Multiple Regression Analysis
Source code and related documents
| Filename | Description |
|---|---|
| R_MRA.txt | R-script (using 'lm') |
| R_MRAorg.txt | R-script (using 'solve') |
| inp_MRA.txt | Input data sample (csv) |
| fig_R_MRA.pdf | Image sample |
Probability Ellipse
Source code and related documents
| Filename | Description |
|---|---|
| R_ELLIPSE.txt | R-script (using 'ellipse') |
| inp_reg1.txt | Input data sample |
| fig_R_ellipse.pdf | Image sample |
Principal Component Analysis
Source code and related documents
| Filename | Description |
|---|---|
| R_PCA.txt | R-script (using 'princomp') |
| R_PCAorg.txt | R-script (using 'eigen') |
| inp_iris.txt | Input data sample |
| fig_R_PCAorg.pdf | Image sample |
Multi-Dimensional Scaling
Source code and related documents
| Filename | Description |
|---|---|
| R_MDS.txt | R-script (using 'cmdscale') |
| R_MDSorg.txt | R-script (using 'eigen') |
| inp_iris.txt | Input data sample |
| fig_R_MDSorg.pdf | Image sample |
Cluster Analysis
Source code and related documents
| Filename | Description |
|---|---|
| R_CLUSTER.txt | R-script (using 'kmeans') |
| R_CLUSTERorg.txt | R-script (using 'eigen') |
| inp_iris.txt | Input data sample |
| fig_R_CLUSPLOT.pdf | Image sample |
| fig_R_CLUSorg.pdf | Image sample |
Discriminant Analysis
Source code and related documents
| Filename | Description |
|---|---|
| R_DCA.txt | R-script (using 'lda') |
| R_DCA_MAHA.txt | R-script (using 'mahalanobis') |
| inp_iris.txt | Input data sample |
| fig_R_DCA.pdf | Image sample (by 'lda') |
| fig_R_MAHA.pdf | Image sample (by 'mahalanobis') |
Hydrological Statistics Analysis
Input Sample data
| Filename | Description |
|---|---|
| inp_RF_S.txt | Rainfall data in Sapporo |
| inp_RF_M.txt | Rainfall data in Maebashi |
| inp_RF_K.txt | Rainfall data in Kyoto |
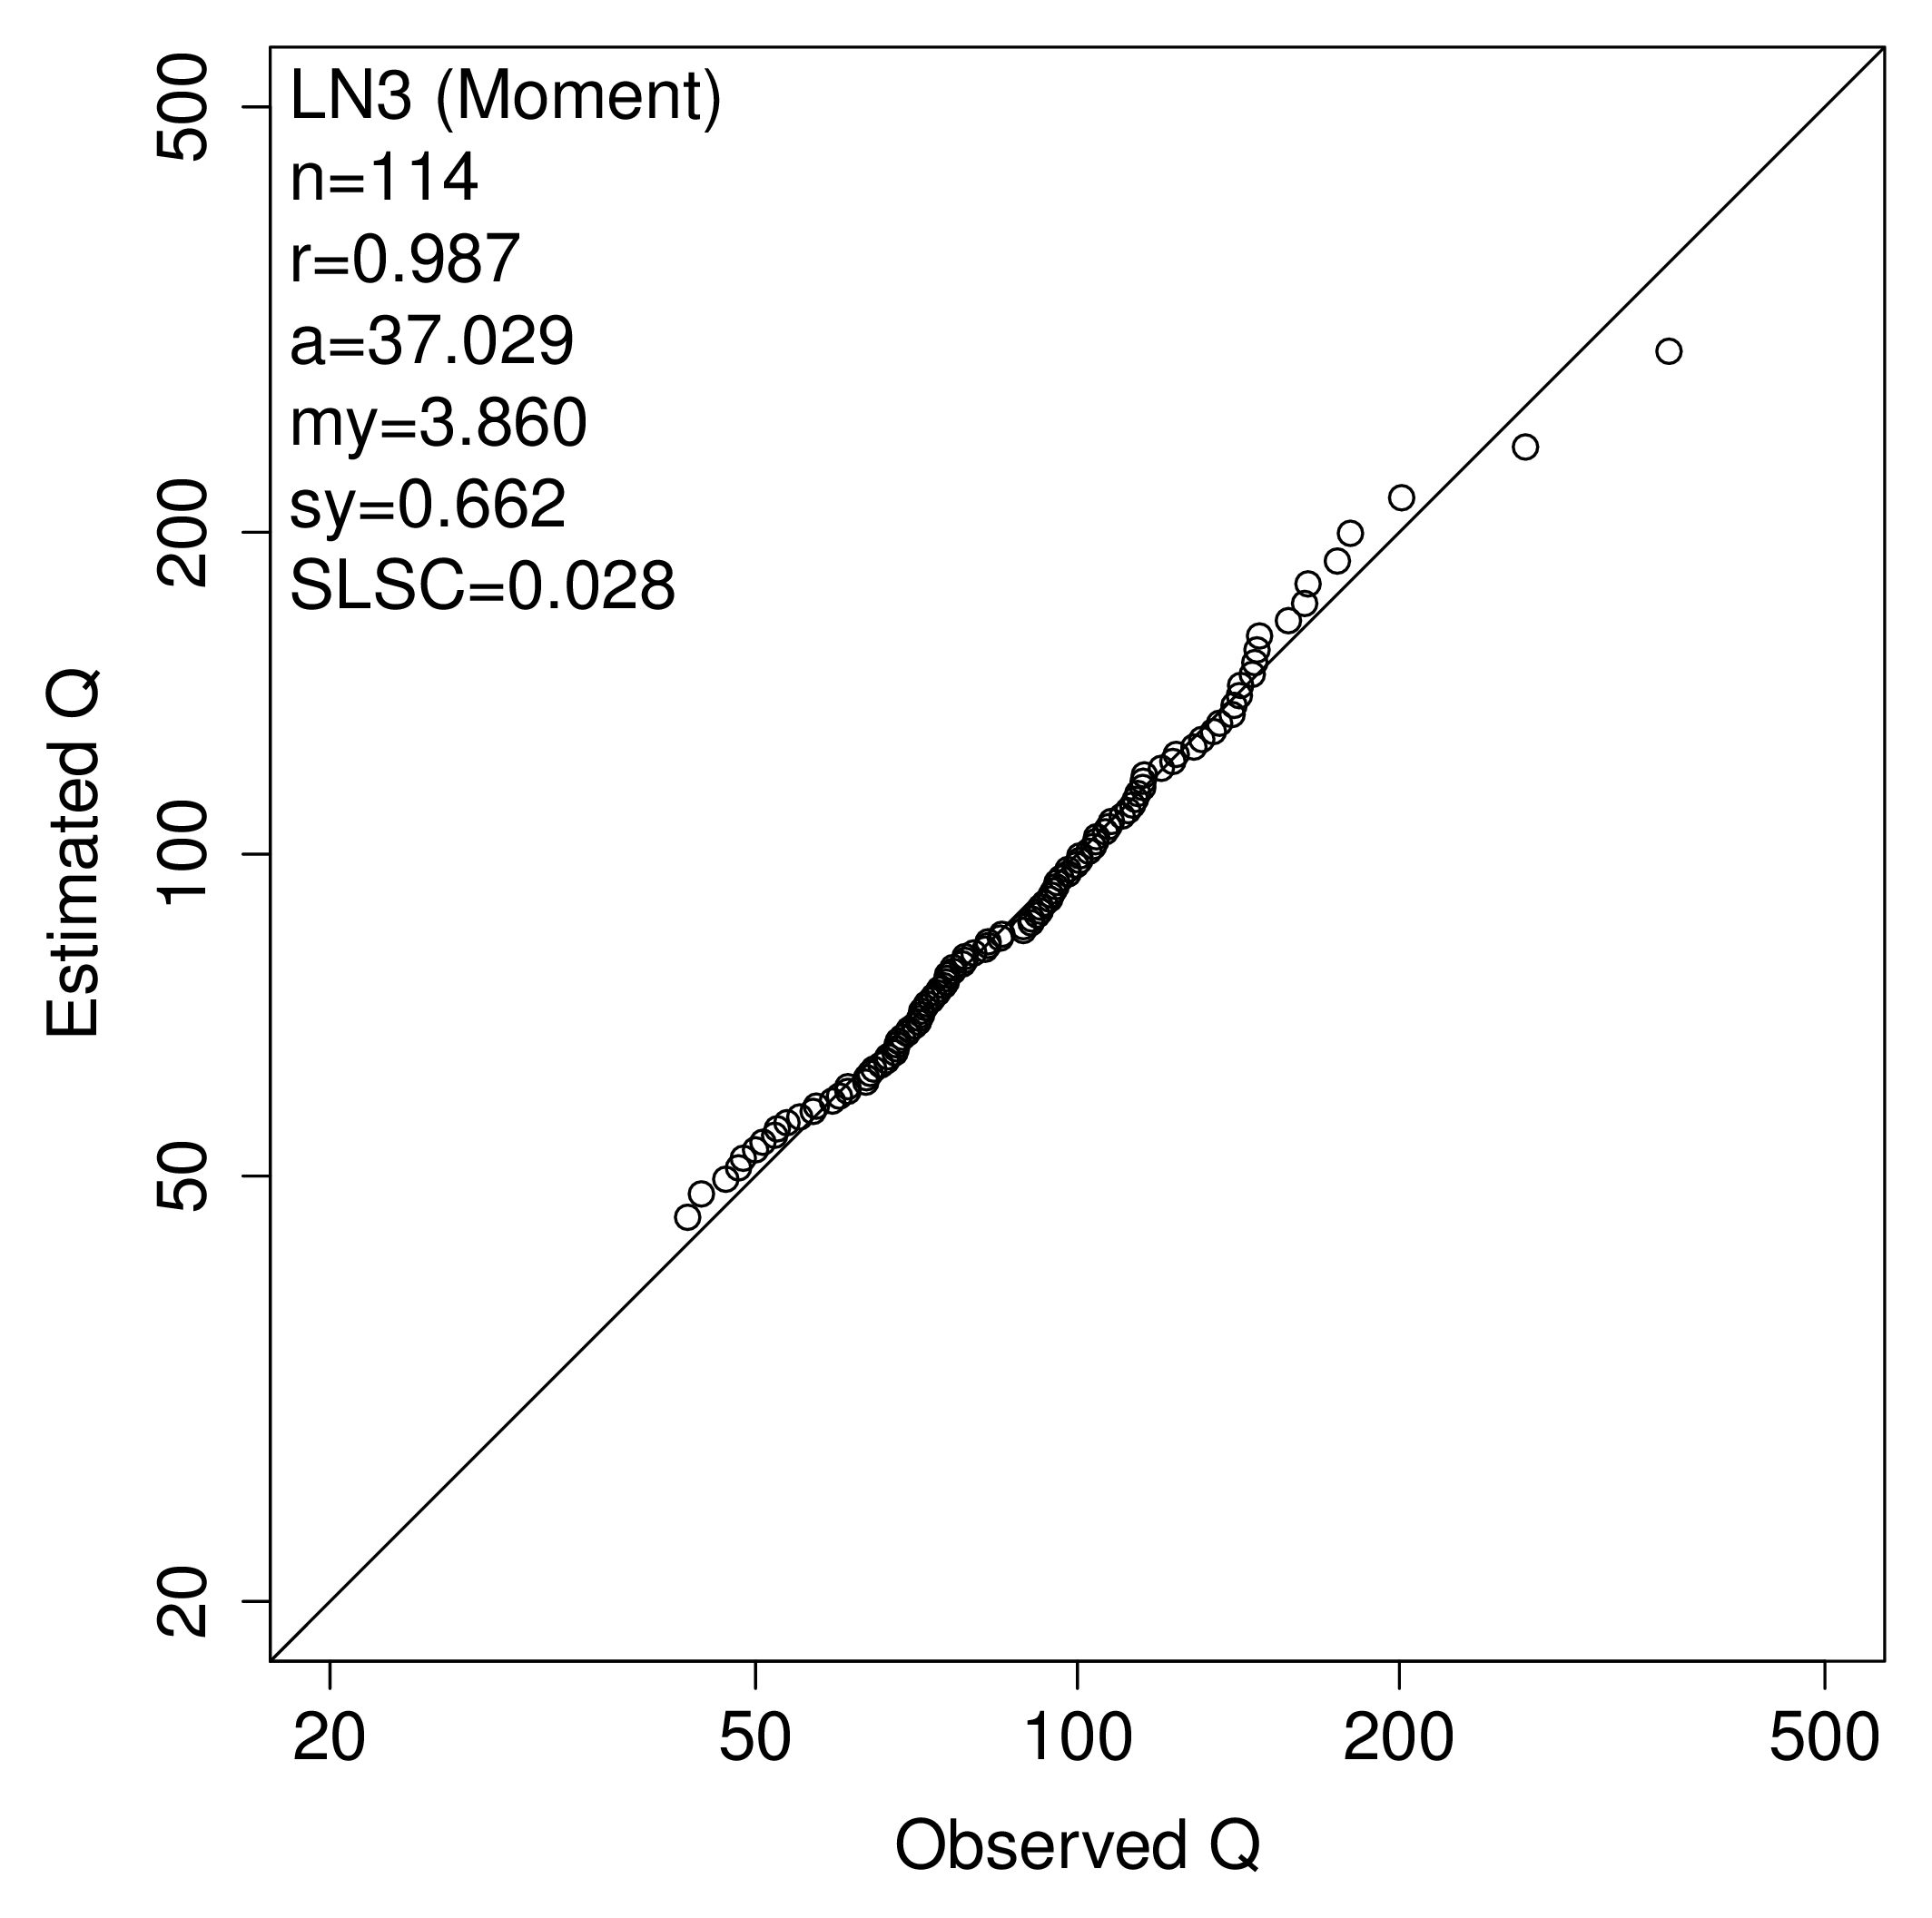
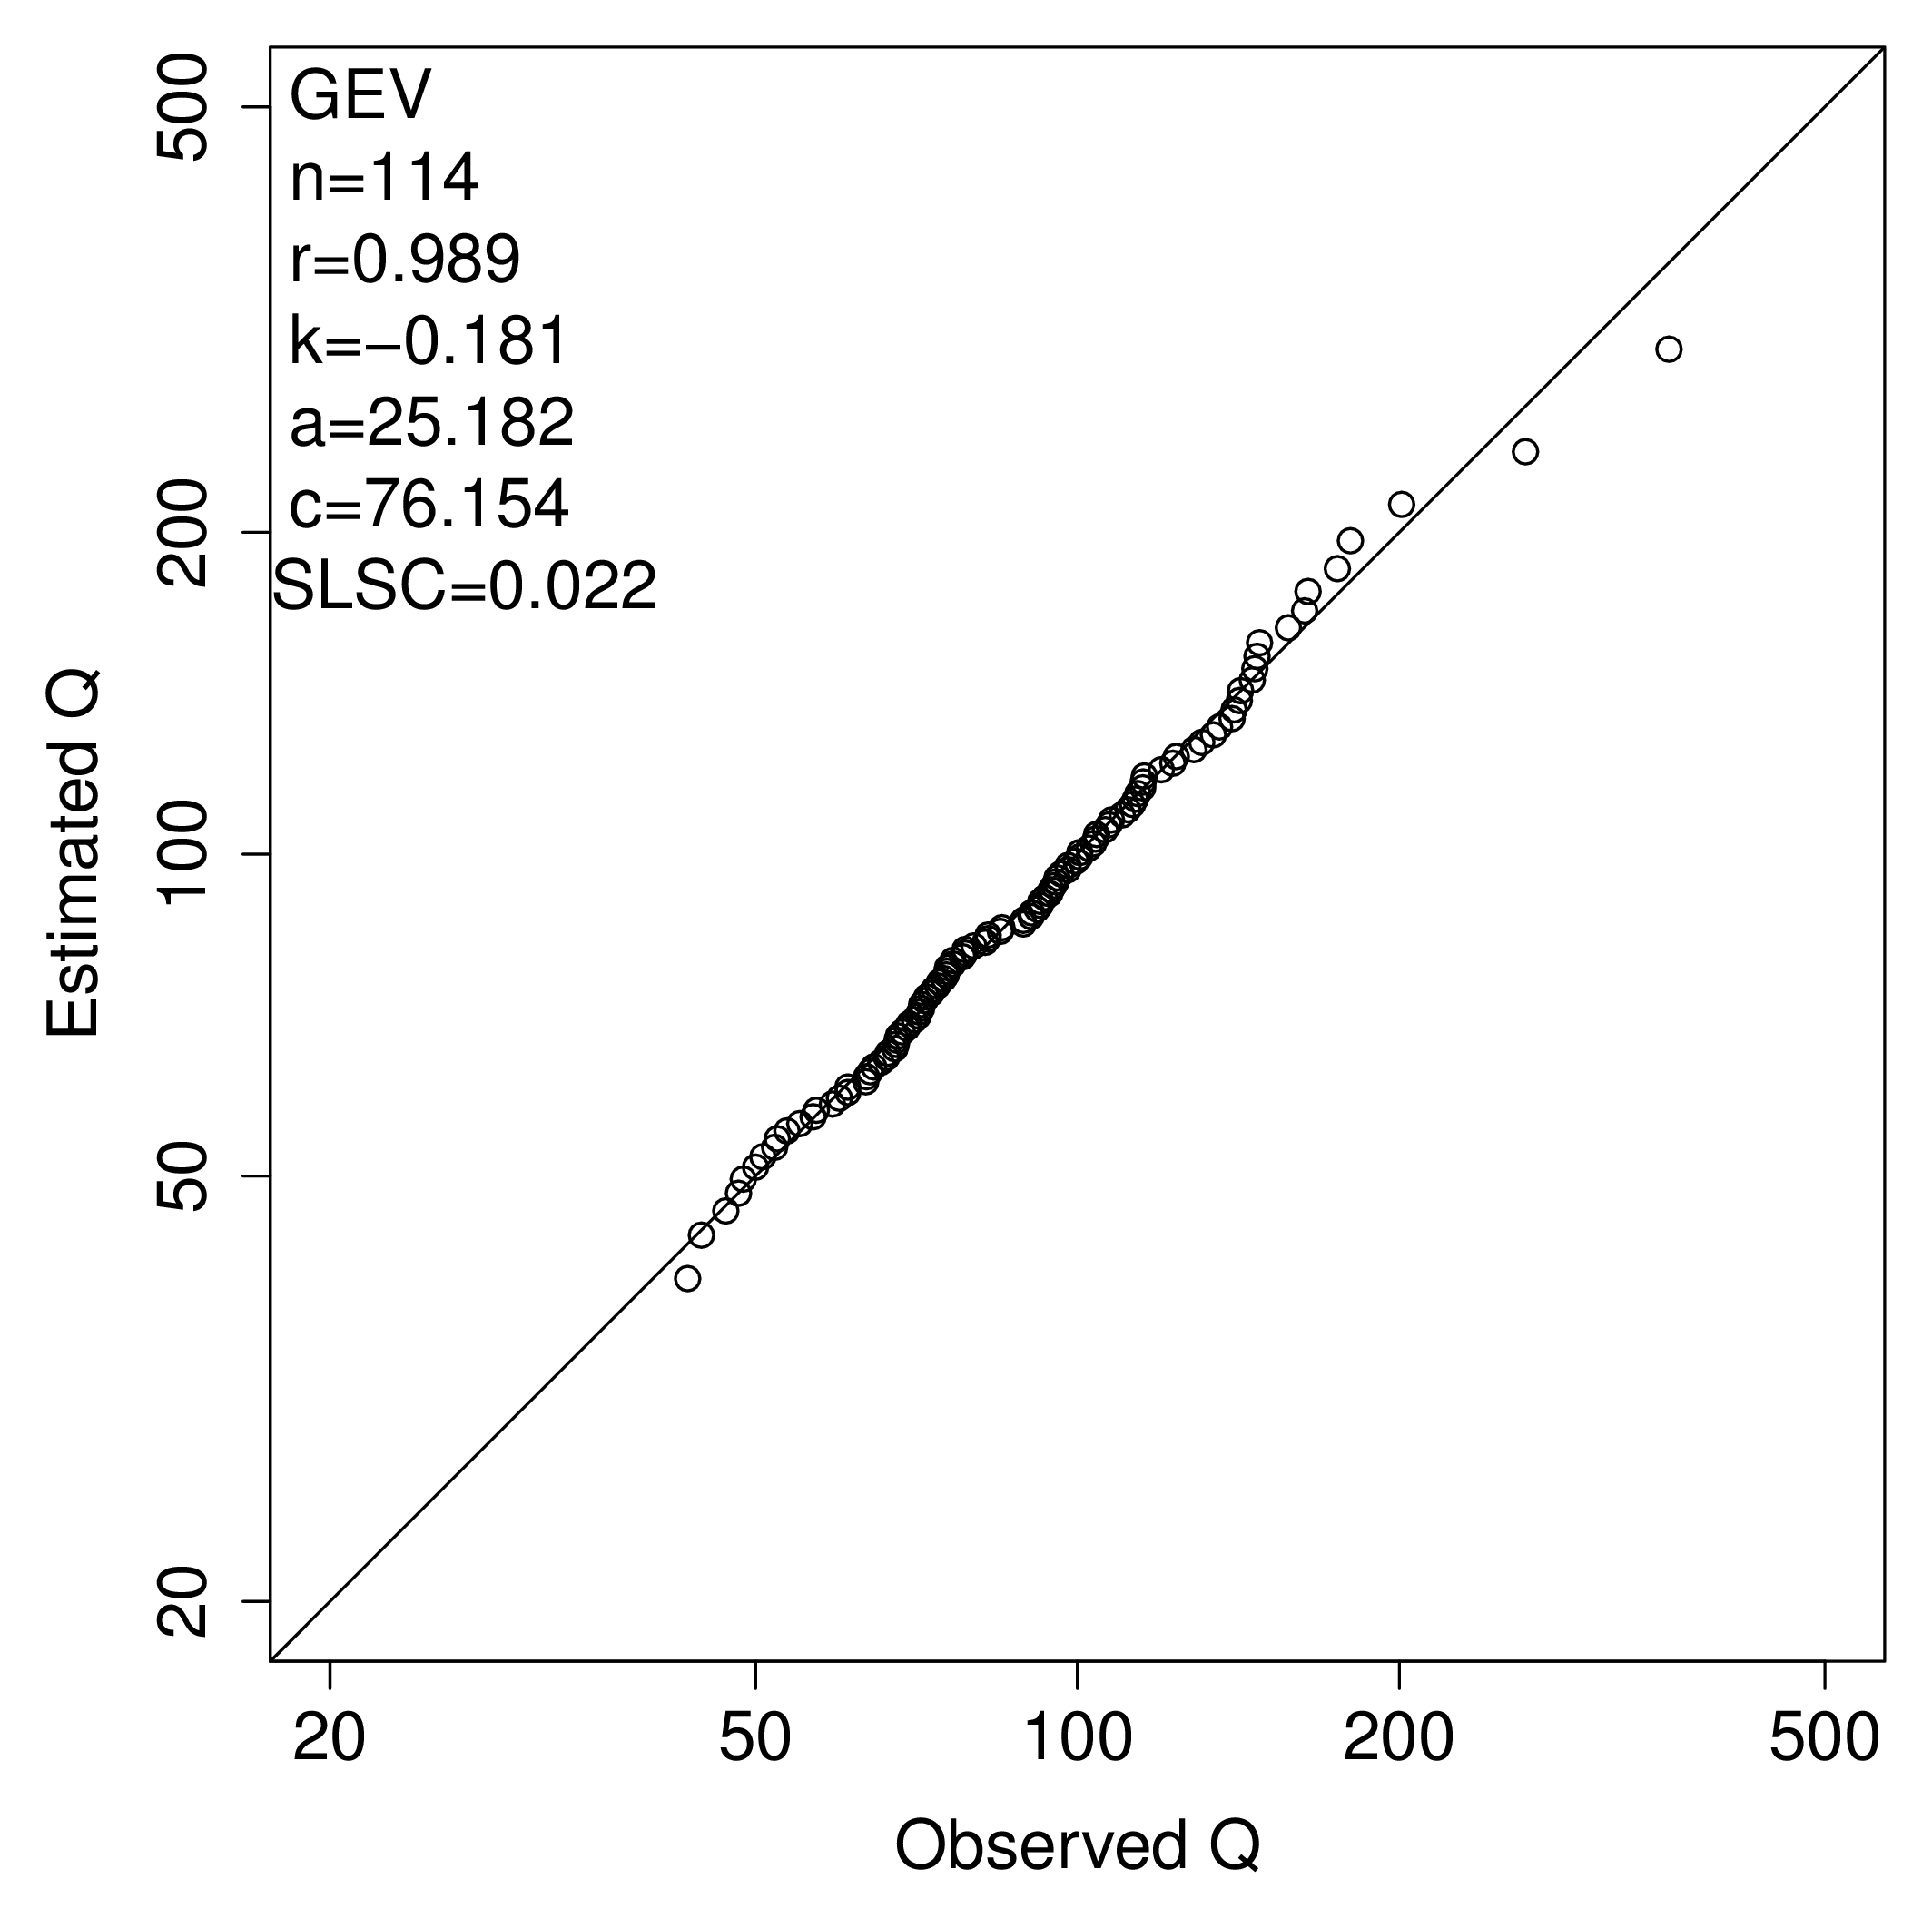
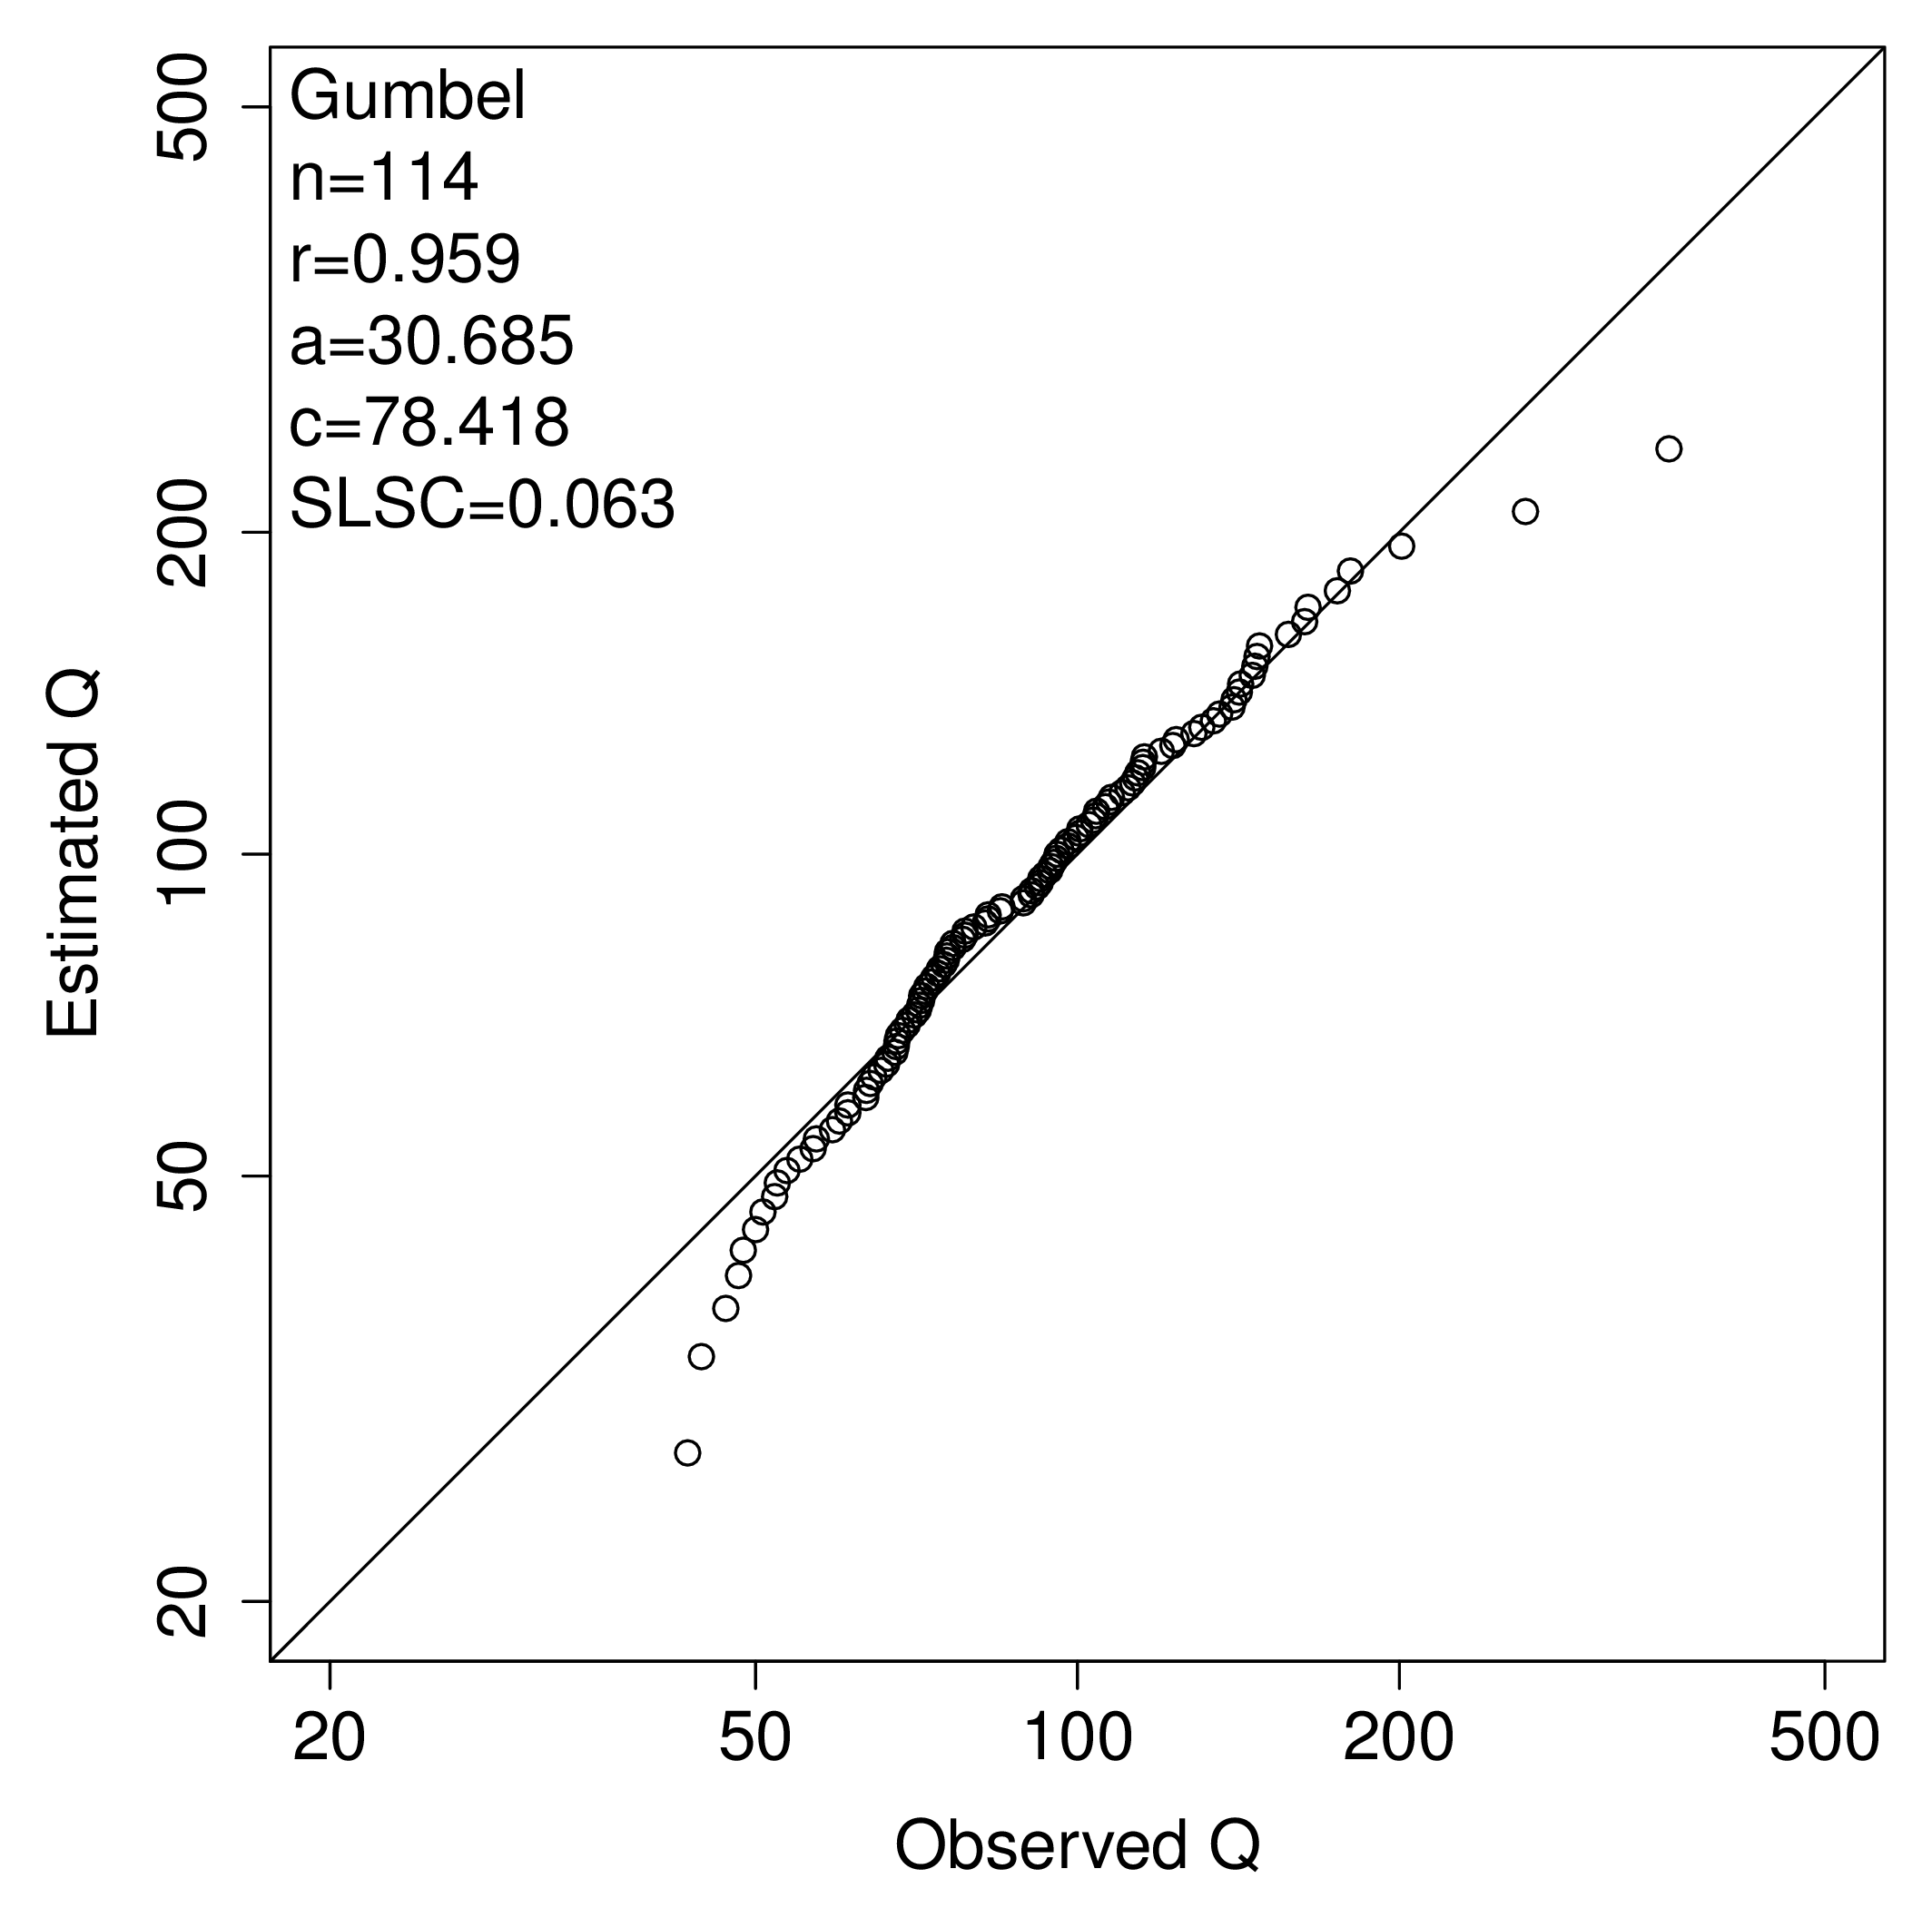
Q-Q plot
| Filename | Description |
|---|---|
| R_HF_qq_LN3_IWAI.txt | R-script (LN3, IWAI) |
| R_HF_qq_LN3_mom.txt | R-script (LN3, moment) |
| R_HF_qq_LP3_mom.txt | R-script (LP3, moment) |
| R_HF_qq_GEV.txt | R-script (GEV) |
| R_HF_qq_Gum.txt | R-script (Gumbel) |
| R_HF_qq_SQRT.txt | R-script (SQRT-ET) |
| fig_R_HF_qq_LN3_IWAI.png | Image sample |
| fig_R_HF_qq_LN3_mom.png | Image sample |
| fig_R_HF_qq_LP3_mom.png | Image sample |
| fig_R_HF_qq_GEV.png | Image sample |
| fig_R_HF_qq_Gum.png | Image sample |
| fig_R_HF_qq_SQRT.png | Image sample |
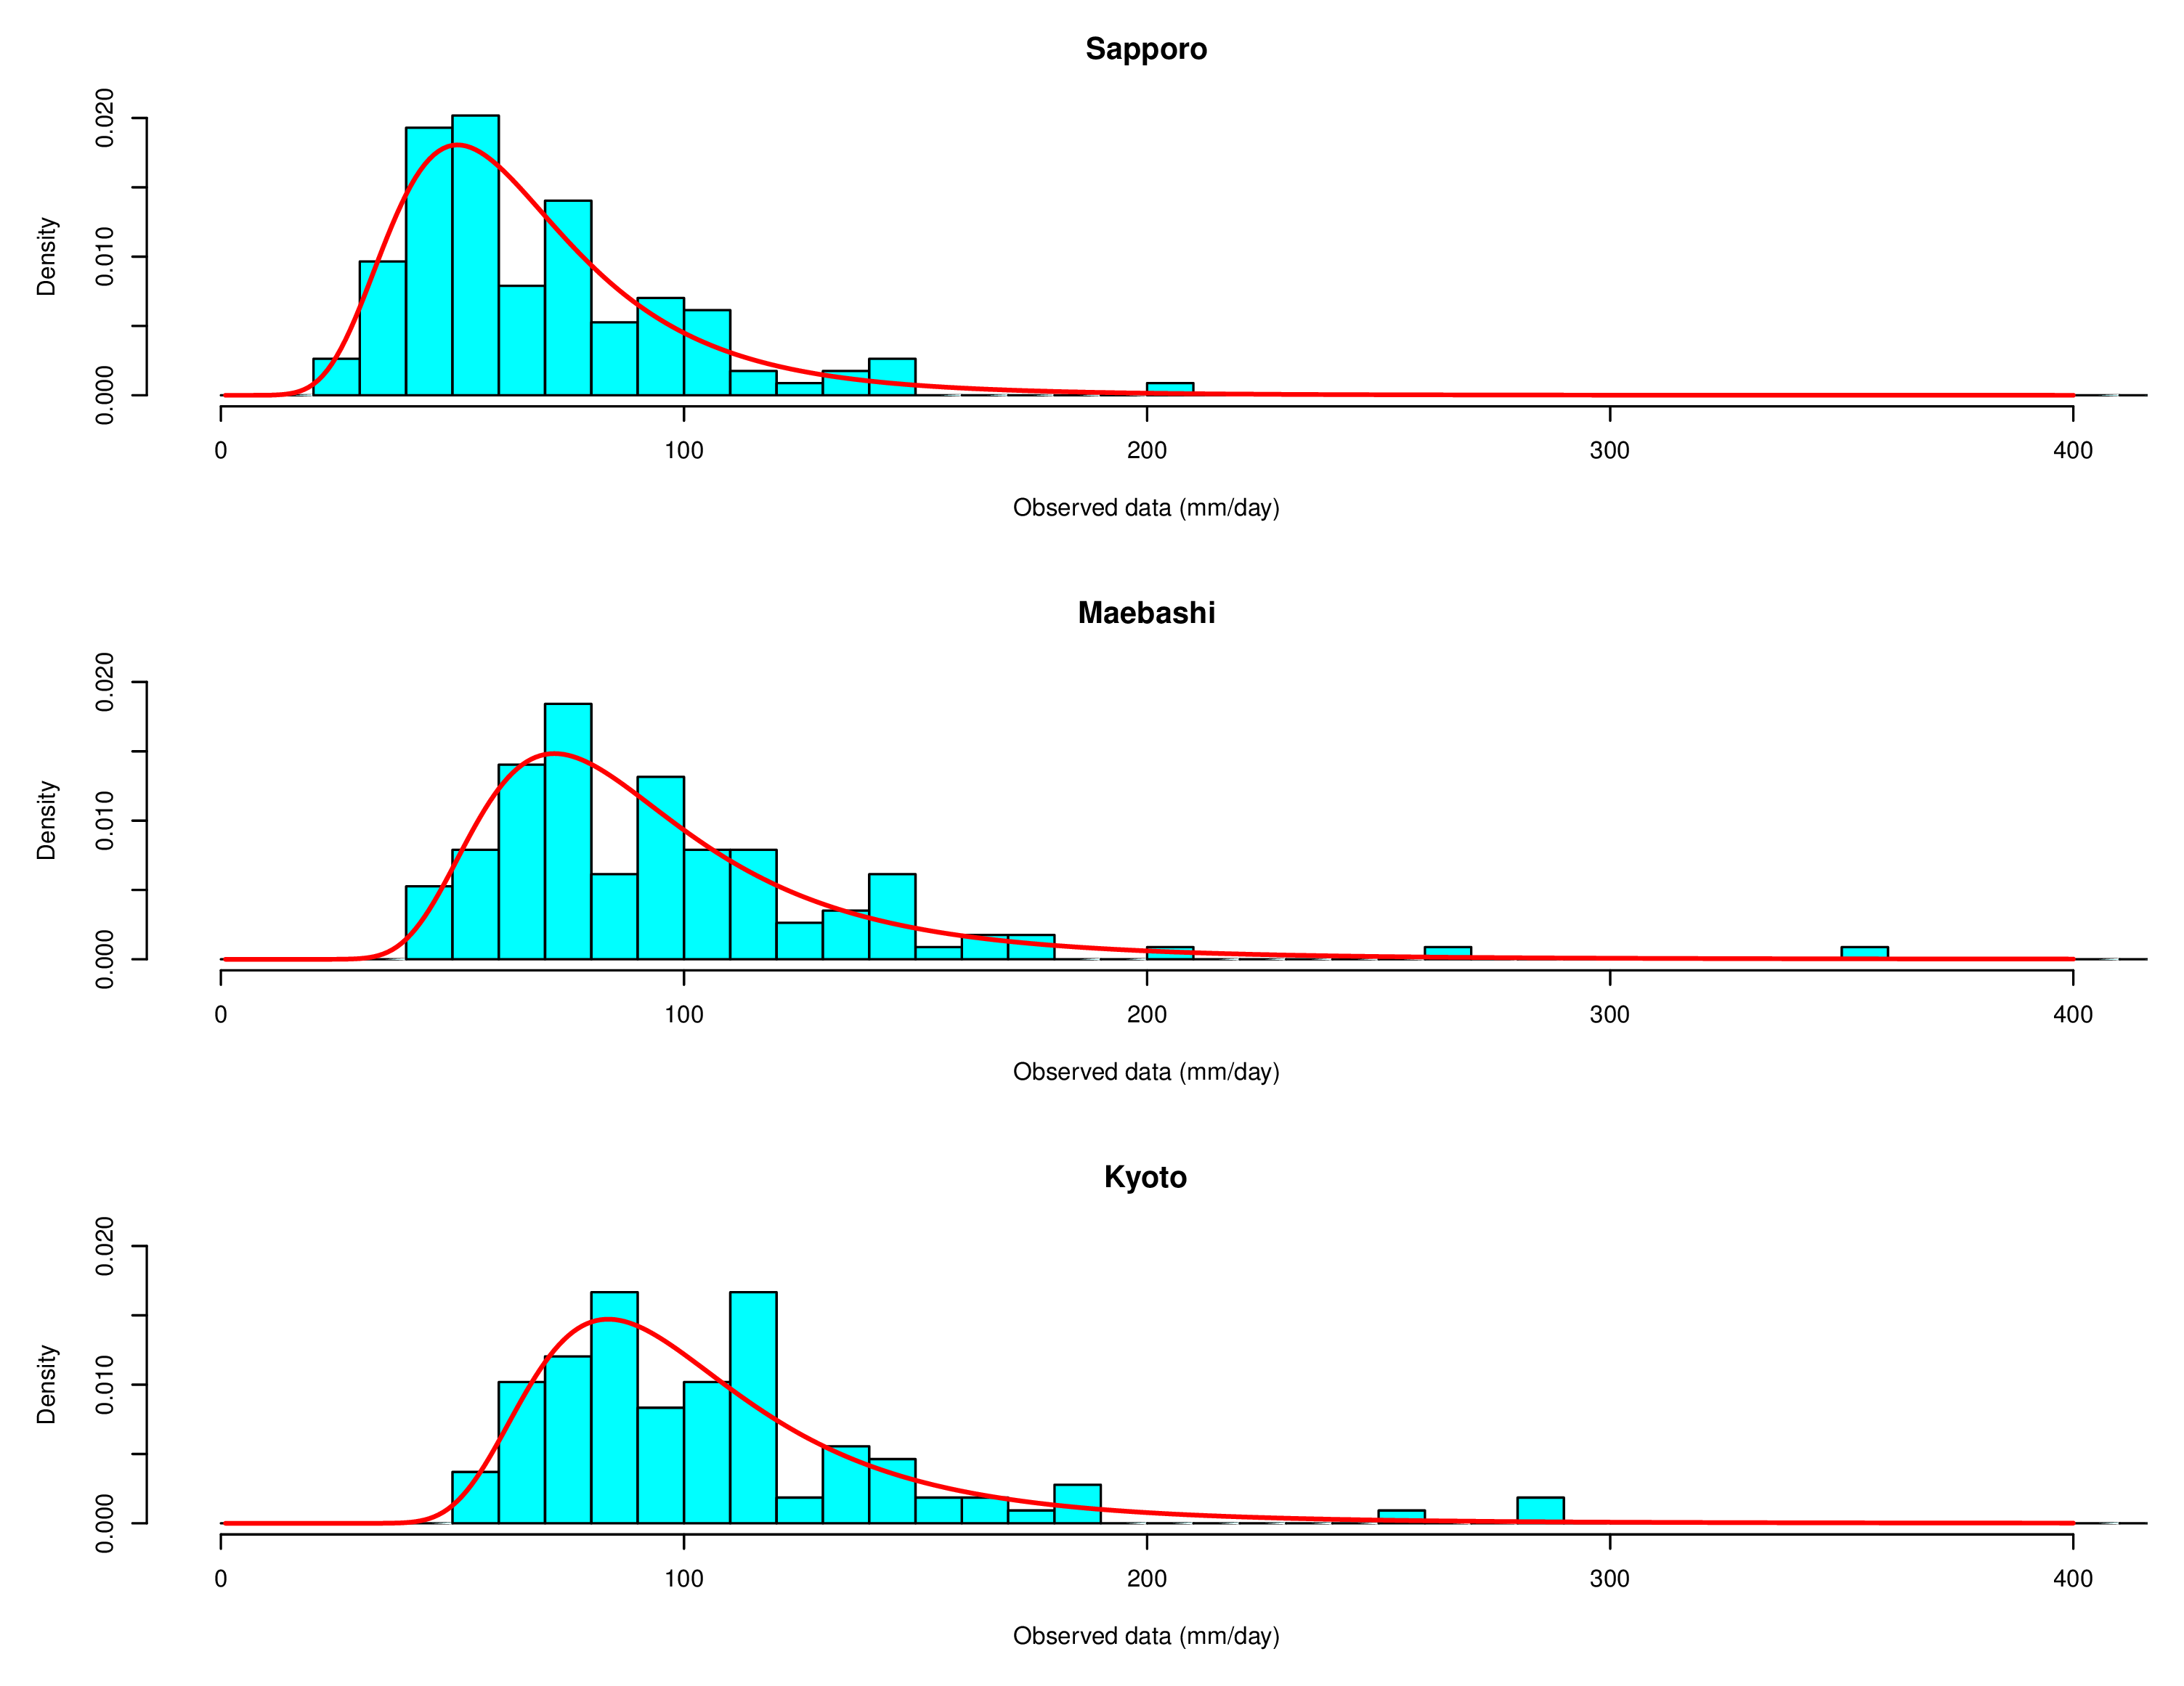
Histogram and GEV probability density function
| Filename | Description |
|---|---|
| R_HF_pdf_GEV.txt | R-script (Histogram & GEV pdf) |
| fig_R_HF_hist_GEV.png | Image sample |
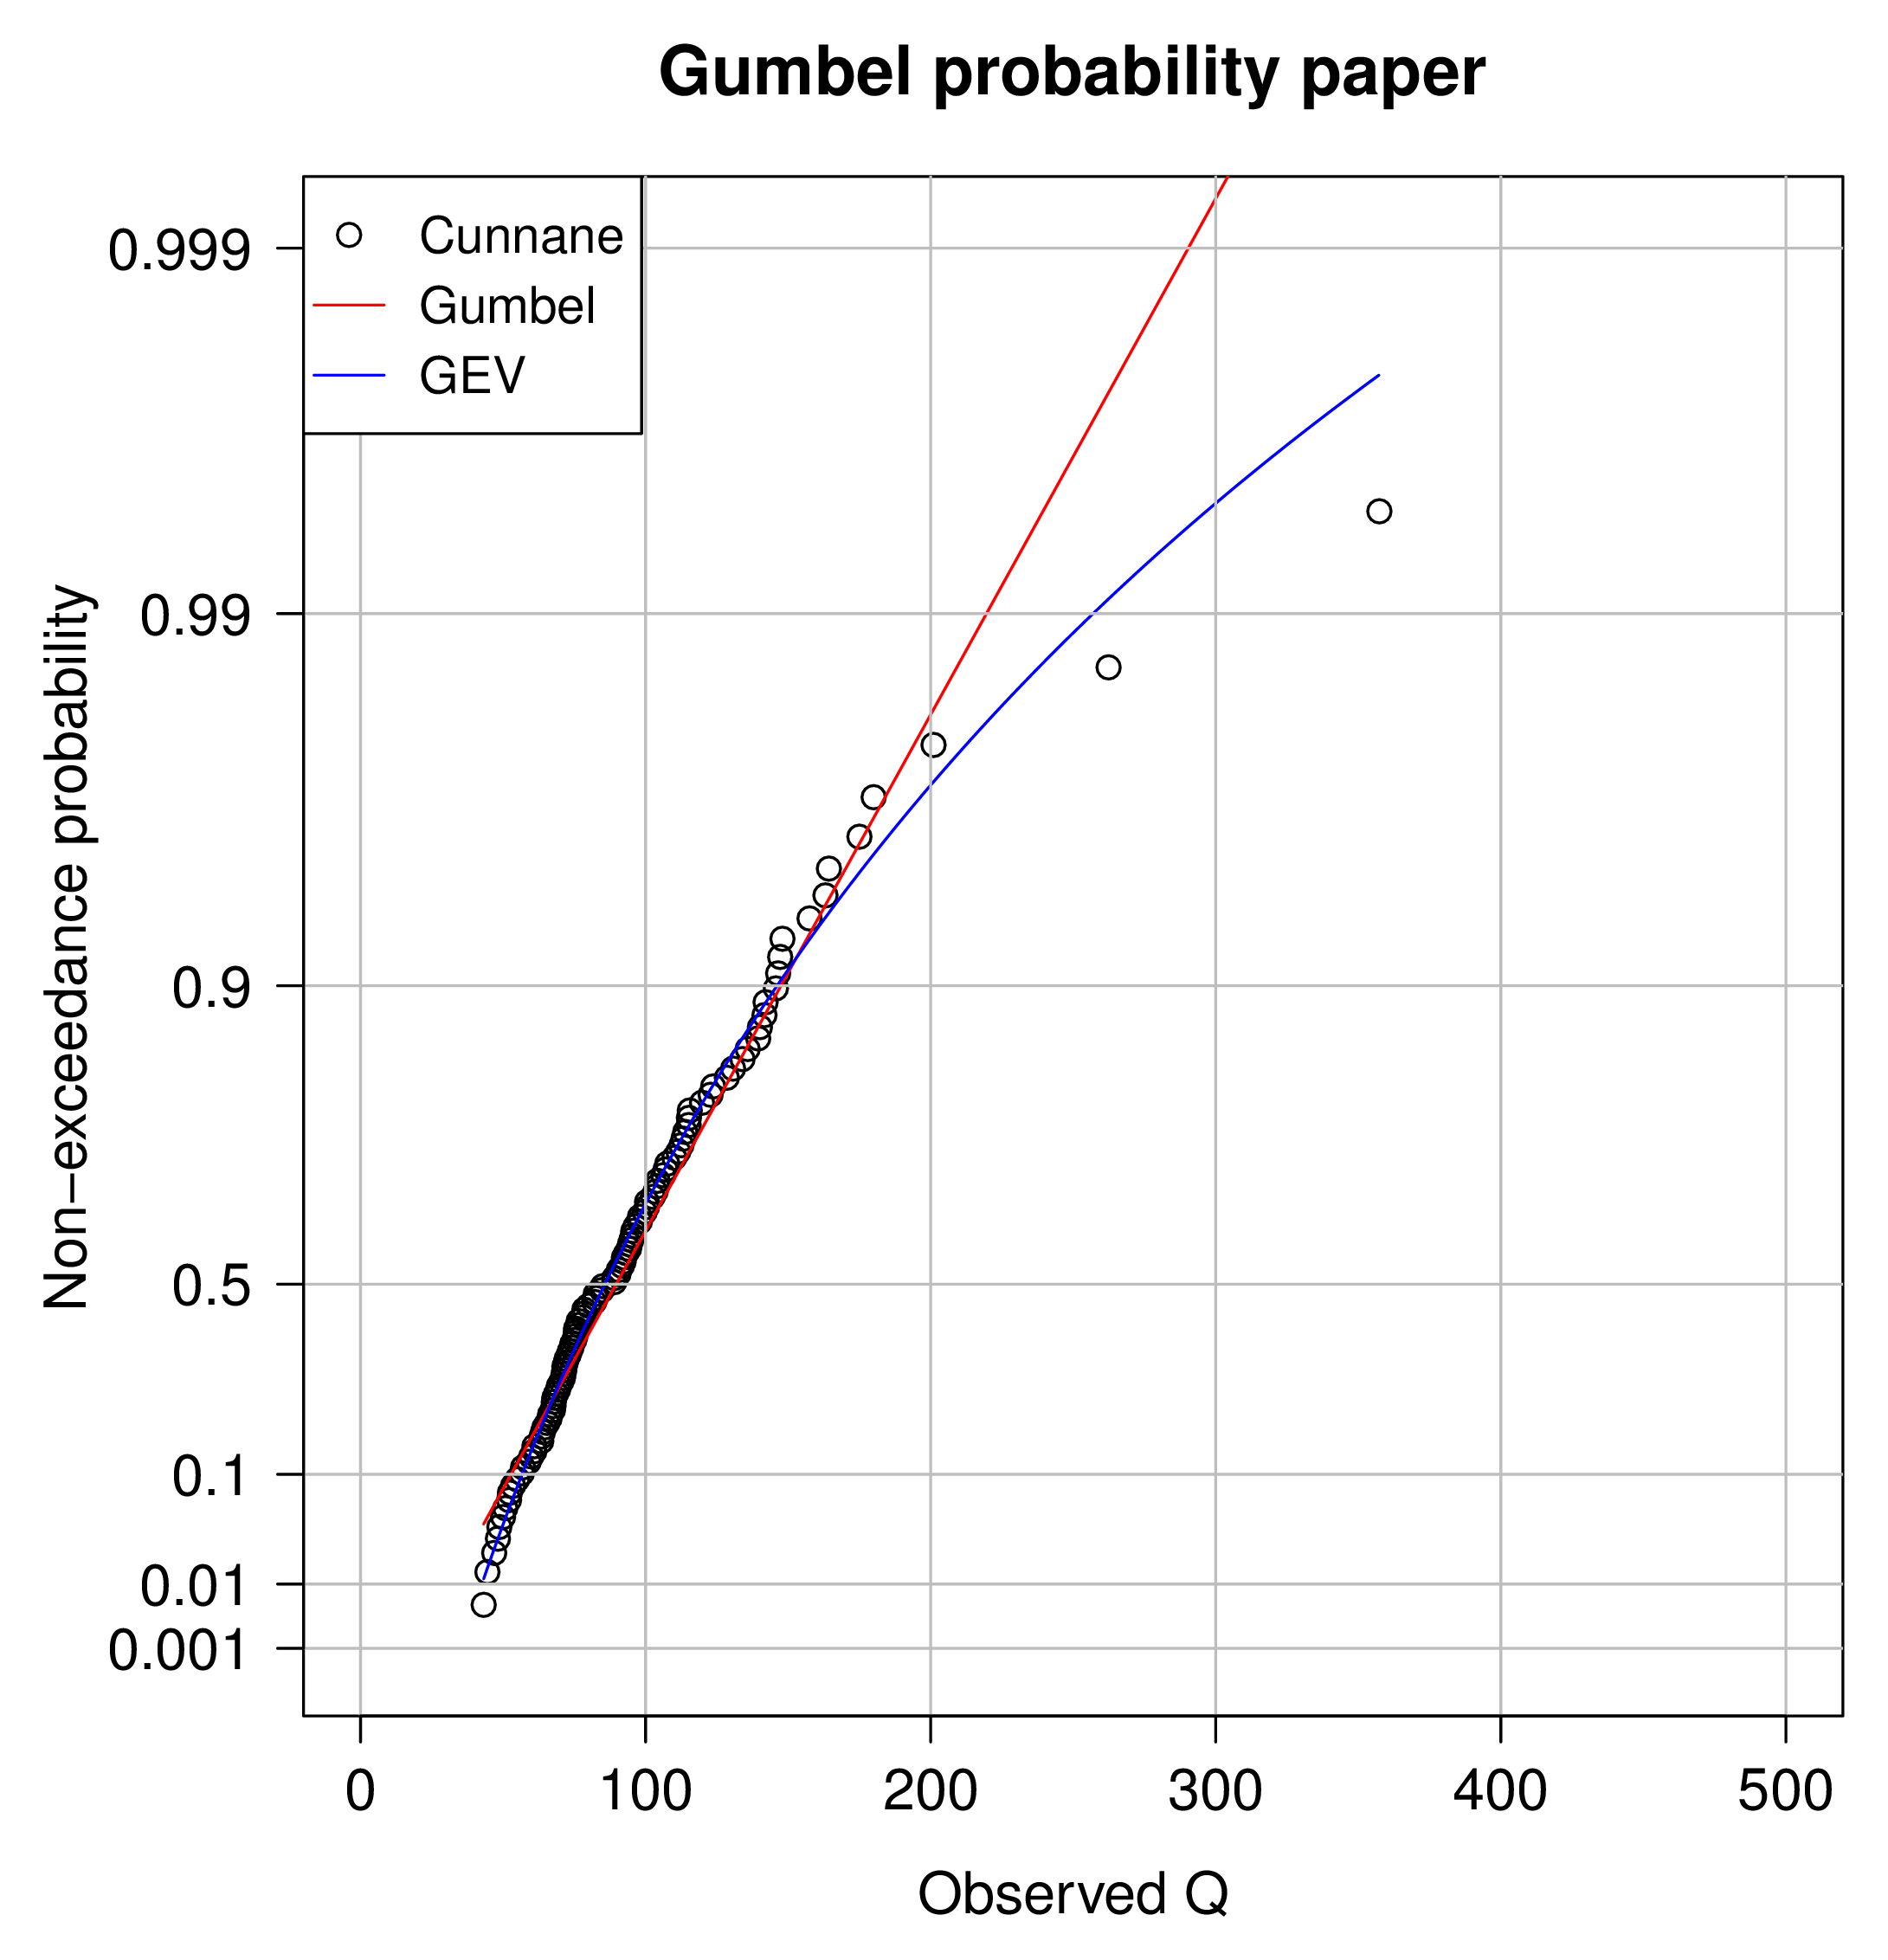
Gumbel probability paper
| Filename | Description |
|---|---|
| R_HF_paper_GUM.txt | R-script (Gumbel probability paper) |
| fig_R_HF_paper_GUM.png | Image sample |
Rejection Test
| Filename | Description |
|---|---|
| R_HF_RT_LN3_IWAI.txt | R-script (Rejection test, LN3, IWAI) |
| R_HF_RT_LP3.txt | R-script (Rejection test, LP3) |
Seismic Response Spectrum using FFT
Basic useage of FFT in R-script
Script for usage of FFT and IFFT
d  <- scan("inp_FFT_1.csv",skip=3)
nn <- length(d)
z  <- fft(d)
z1 <- Re(z)/nn
z2 <- Im(z)/nn
cc <- sqrt(z1*z1+z2*z2)
zz <- complex(re=z1*nn,im=z2*nn)
y  <- Re(fft(zz,inverse=TRUE))/nn
out<- cbind(d,z1,z2,cc,y)
write.table(out,"out_FFT_1.txt",quote=F,append=F,row.names=F)
Sample input data
Example
dt,1.0
ndata,16
5
32
38
-33
-19
-10
1
-8
-20
10
-1
4
11
-1
-7
-2
Sample output data by 'R'
  d  z1                z2               cc                 y
  5  0                 0                0                  5
 32  3.87961256380478  2.07134405386938 4.3979381344821   32
 38  2.74448051533946 -4.19010191002141 5.00890480199445  38
-33  2.47896579998472 -5.9762205702964  6.46996783163006 -33
-19 -3.375            -4.375            5.52550902632509 -19
-10 -2.09400457708259  1.92803176917456 2.84642963584018 -10
  1 -3.61948051533946  1.18489808997859 3.80849349278122   0.999999999999996
 -8  1.98542621329309  2.47559639334034 3.17340428422712  -8
-20  1                 0                1                -20
 10  1.98542621329309 -2.47559639334034 3.17340428422712  10
 -1 -3.61948051533946 -1.18489808997859 3.80849349278123  -1
  4 -2.0940045770826  -1.92803176917456 2.84642963584018   4
 11 -3.375             4.375            5.52550902632509  11
 -1  2.47896579998472  5.9762205702964  6.46996783163006  -1
 -7  2.74448051533946  4.19010191002141 5.00890480199445  -7
 -2  3.87961256380478 -2.07134405386938 4.3979381344821   -2
Source code and related documents for calculation of Seismic Responce Spectrum
Input wave data
| dat_acc_TCGH16_EW2.txt | Input data sample (1) |
| dat_acc_TCGH16_NS2.txt | Input data sample (2) |
| dat_acc_TCGH16_UD2.txt | Input data sample (3) |
Time sequence diagram of input wave data
| R_EQdat.txt | R-script for drawing (oroginal acc.wave) |
| fig_R_acc_org.pdf | Image sample (original acc.wave) |
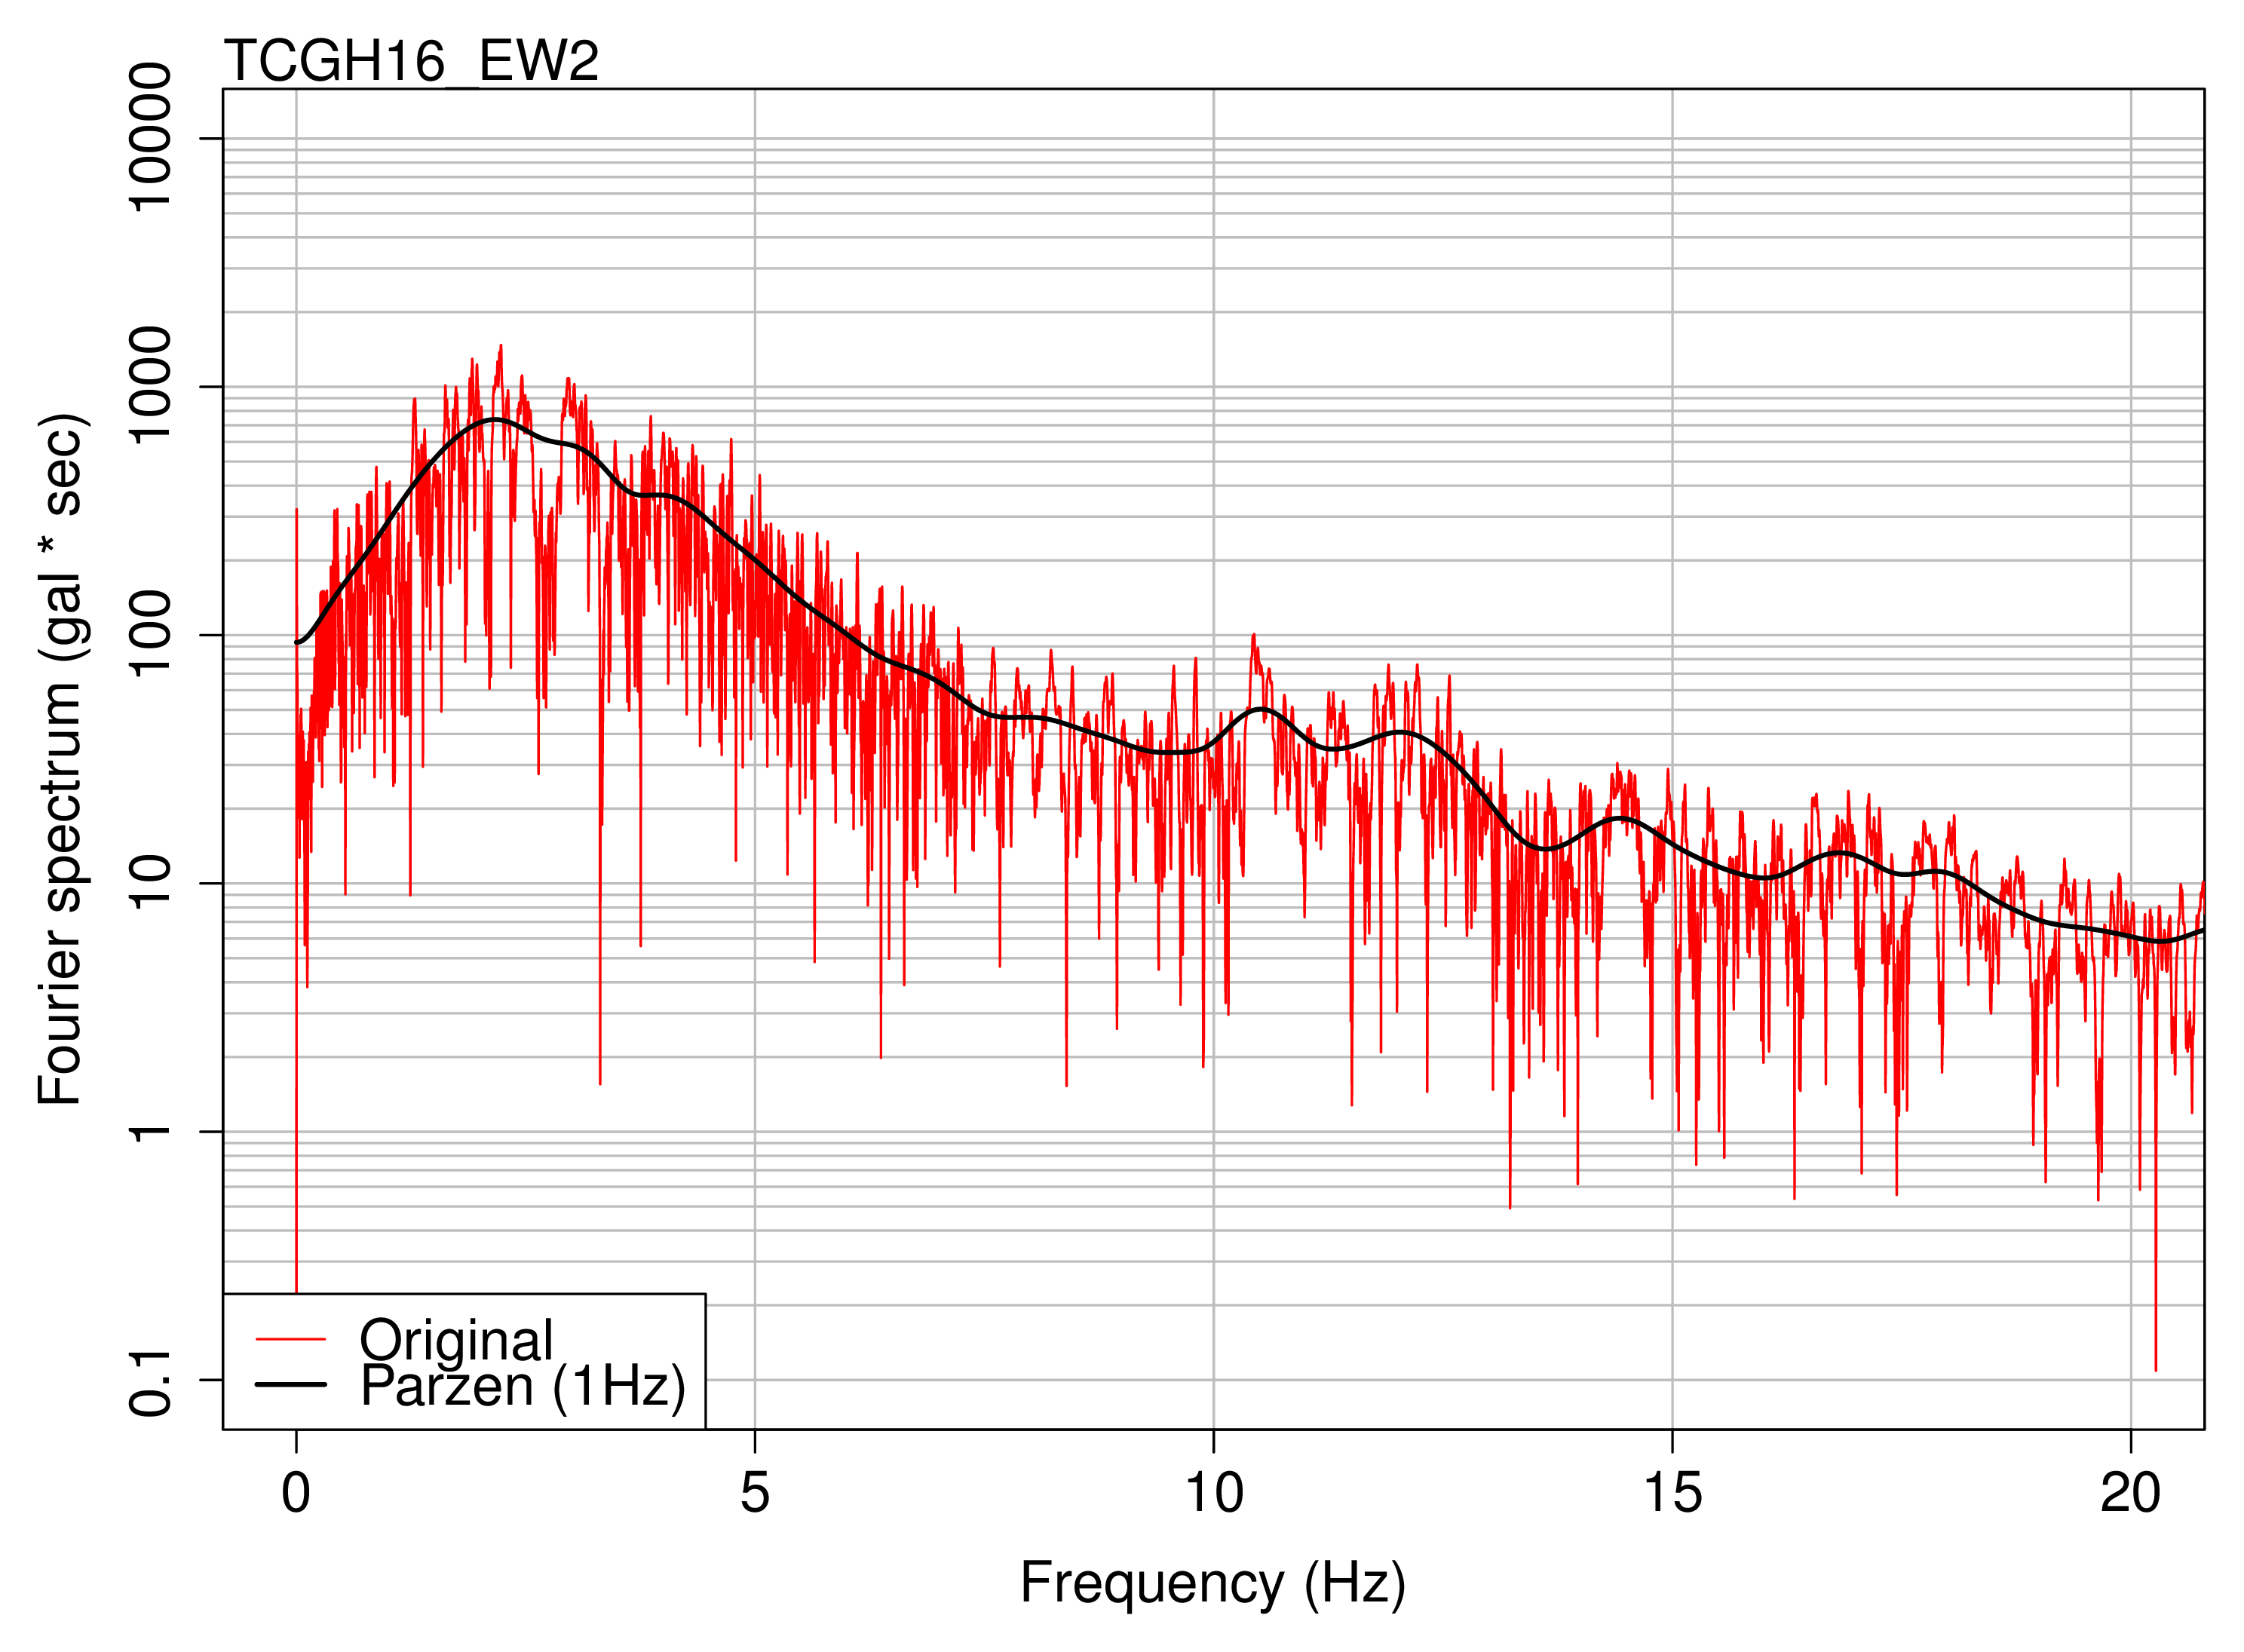
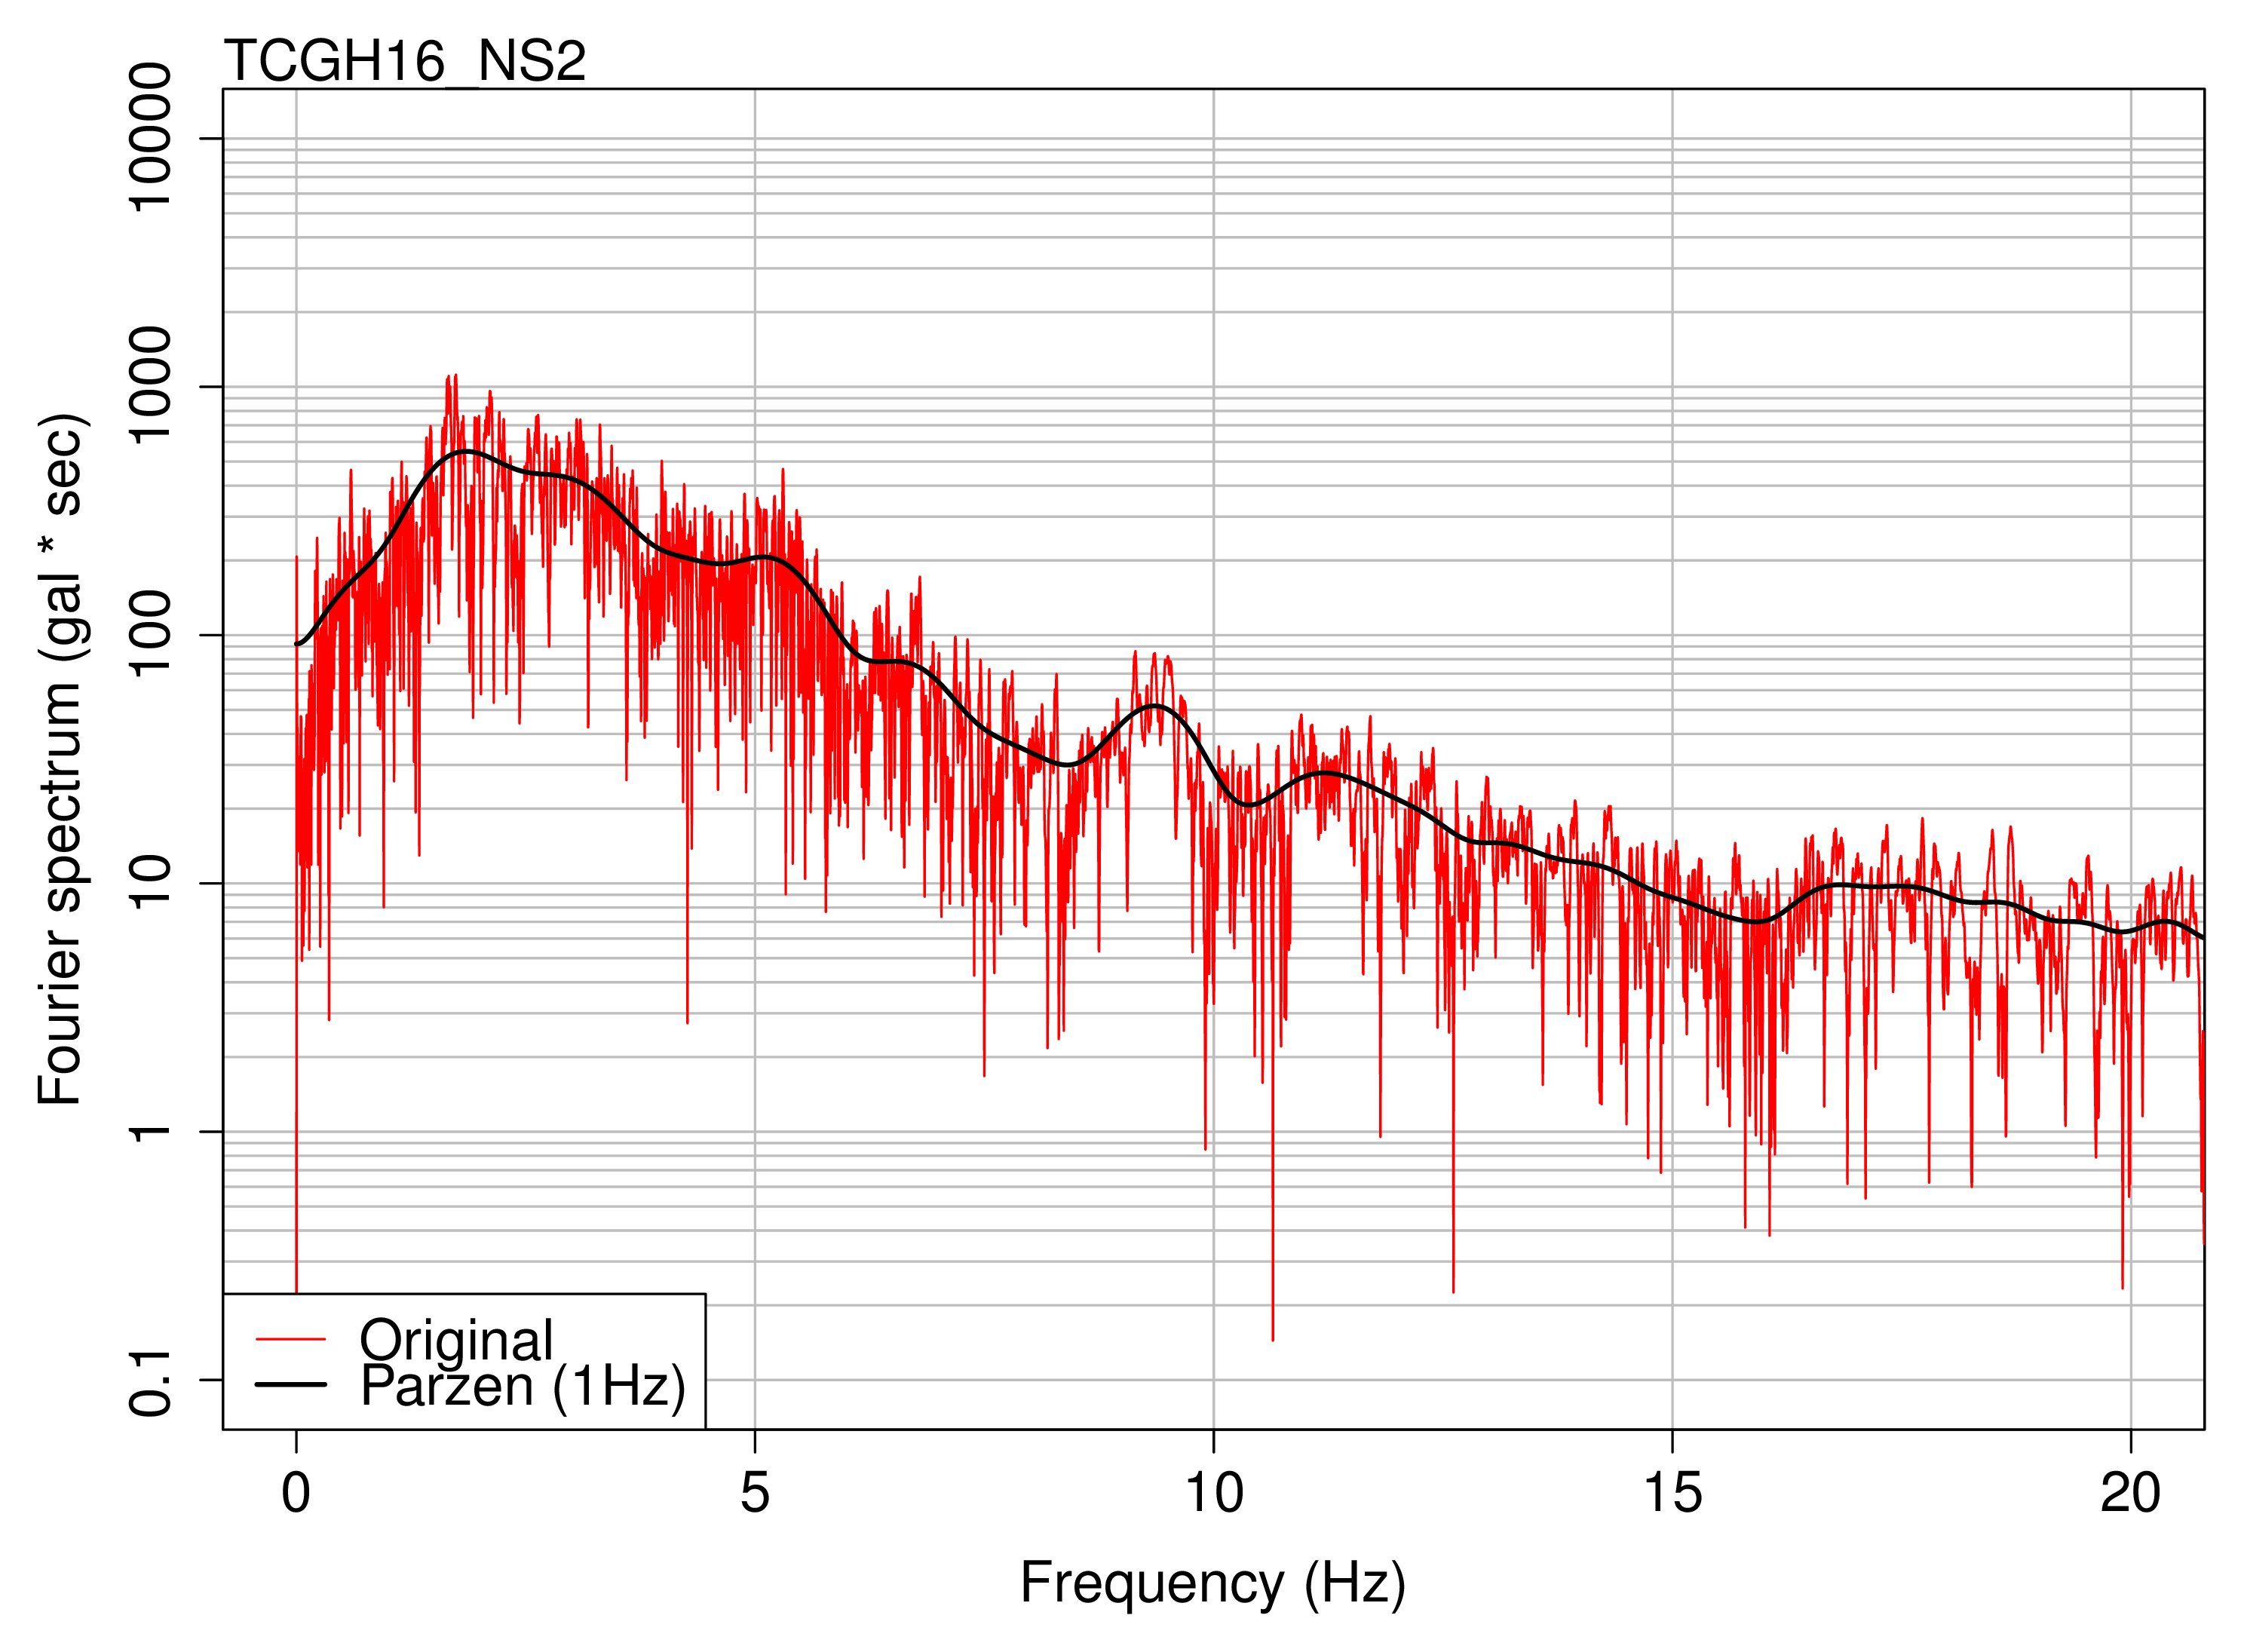
Fourier spectrum of input wave data
| R_FSP.txt | R-script for calculation of Fourier spectrum |
| R_NL_graph.txt | R-script for drawing (Fourier spectrum) |
| dat_spc_1.txt | Output data sample (1) |
| dat_spc_2.txt | Output data sample (2) |
| dat_spc_3.txt | Output data sample (3) |
| fig_R_fsp_1.png | Image sample (original acc.wave 1) |
| fig_R_fsp_2.png | Image sample (original acc.wave 2) |
| fig_R_fsp_3.png | Image sample (original acc.wave 3) |
Acceleration response spectrum
| Filename | Description |
|---|---|
| R_RSA.txt | R-script for calculation of spectrum |
| R_LL_graph.txt | R-script for drawing (response spectrum) |
| dat_spc_1.txt | Output data sample (1) |
| dat_spc_2.txt | Output data sample (2) |
| dat_spc_3.txt | Output data sample (3) |
| fig_R_spc.pdf | Image sample (spectrum) |