Outline of this page
Following items are shown in this page.
Following items are shown in this page.
| Filename | Description |
|---|---|
| bat_jmap0.txt | Batch file for GMT execution |
| bat_jmap1.txt | Batch file for GMT execution |
| bat_jmap2.txt | Batch file for GMT execution |
| inp_city.txt | Input file for jmap2 (coordinates of cities) |
| inp_pref.txt | Input file for Jmap2 (boundary of prefectures) |
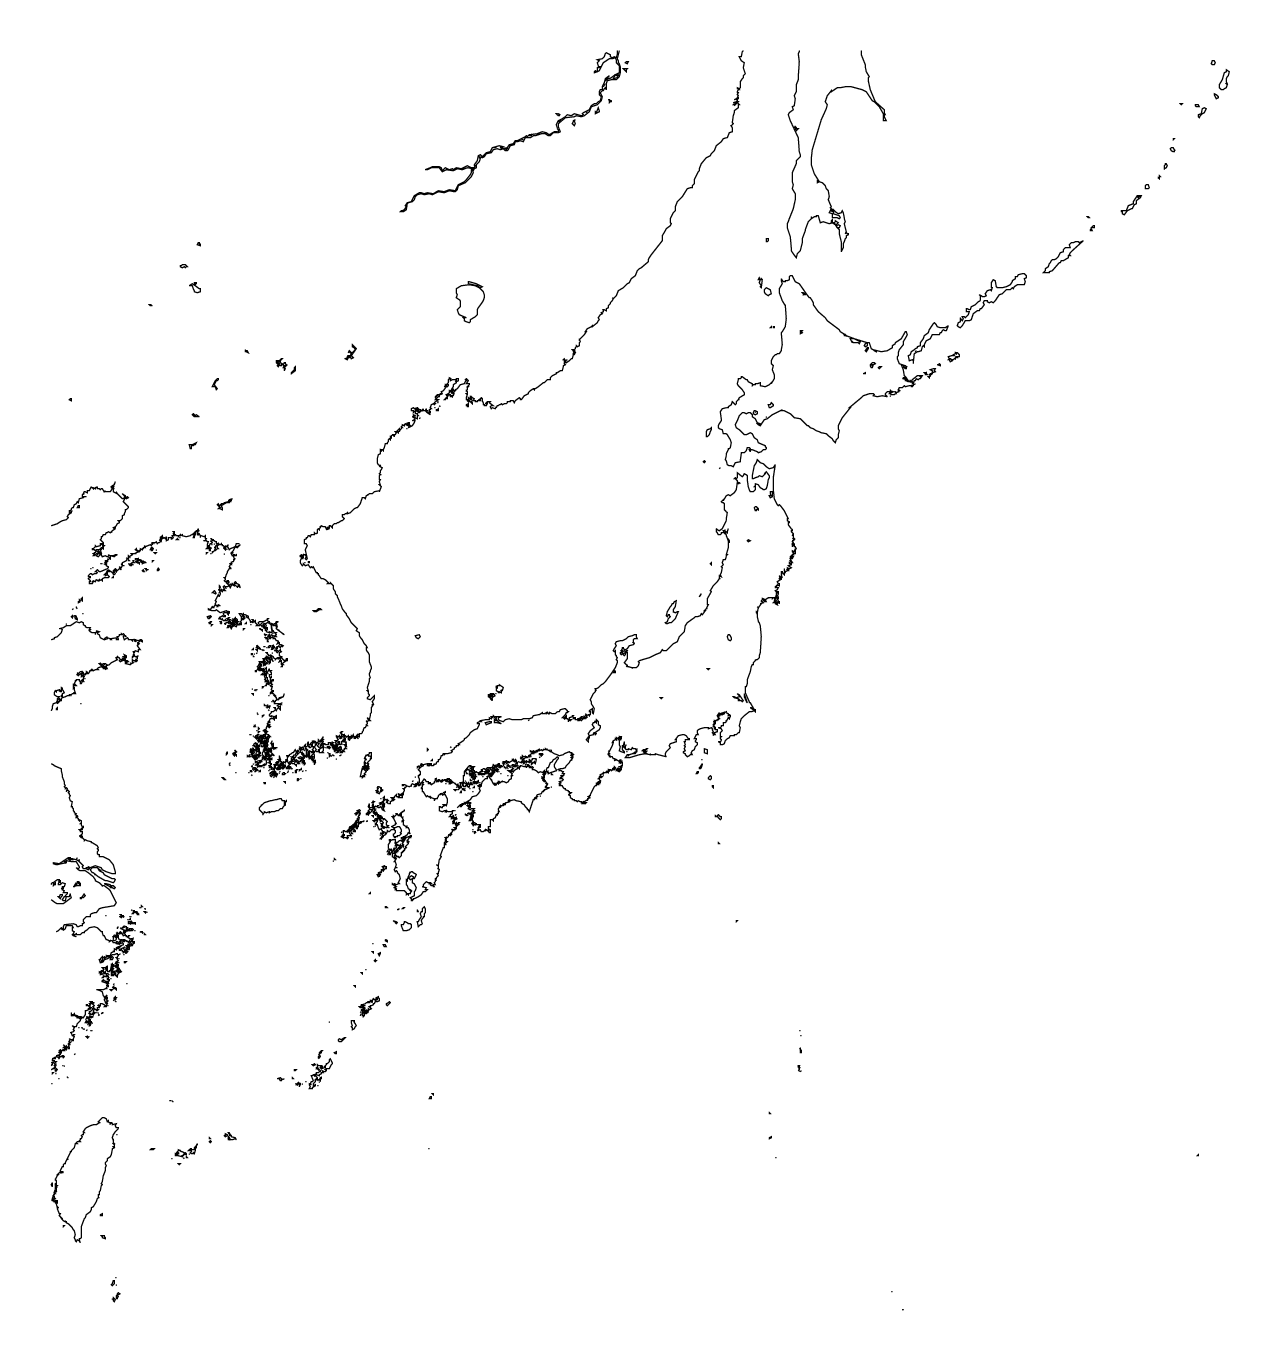
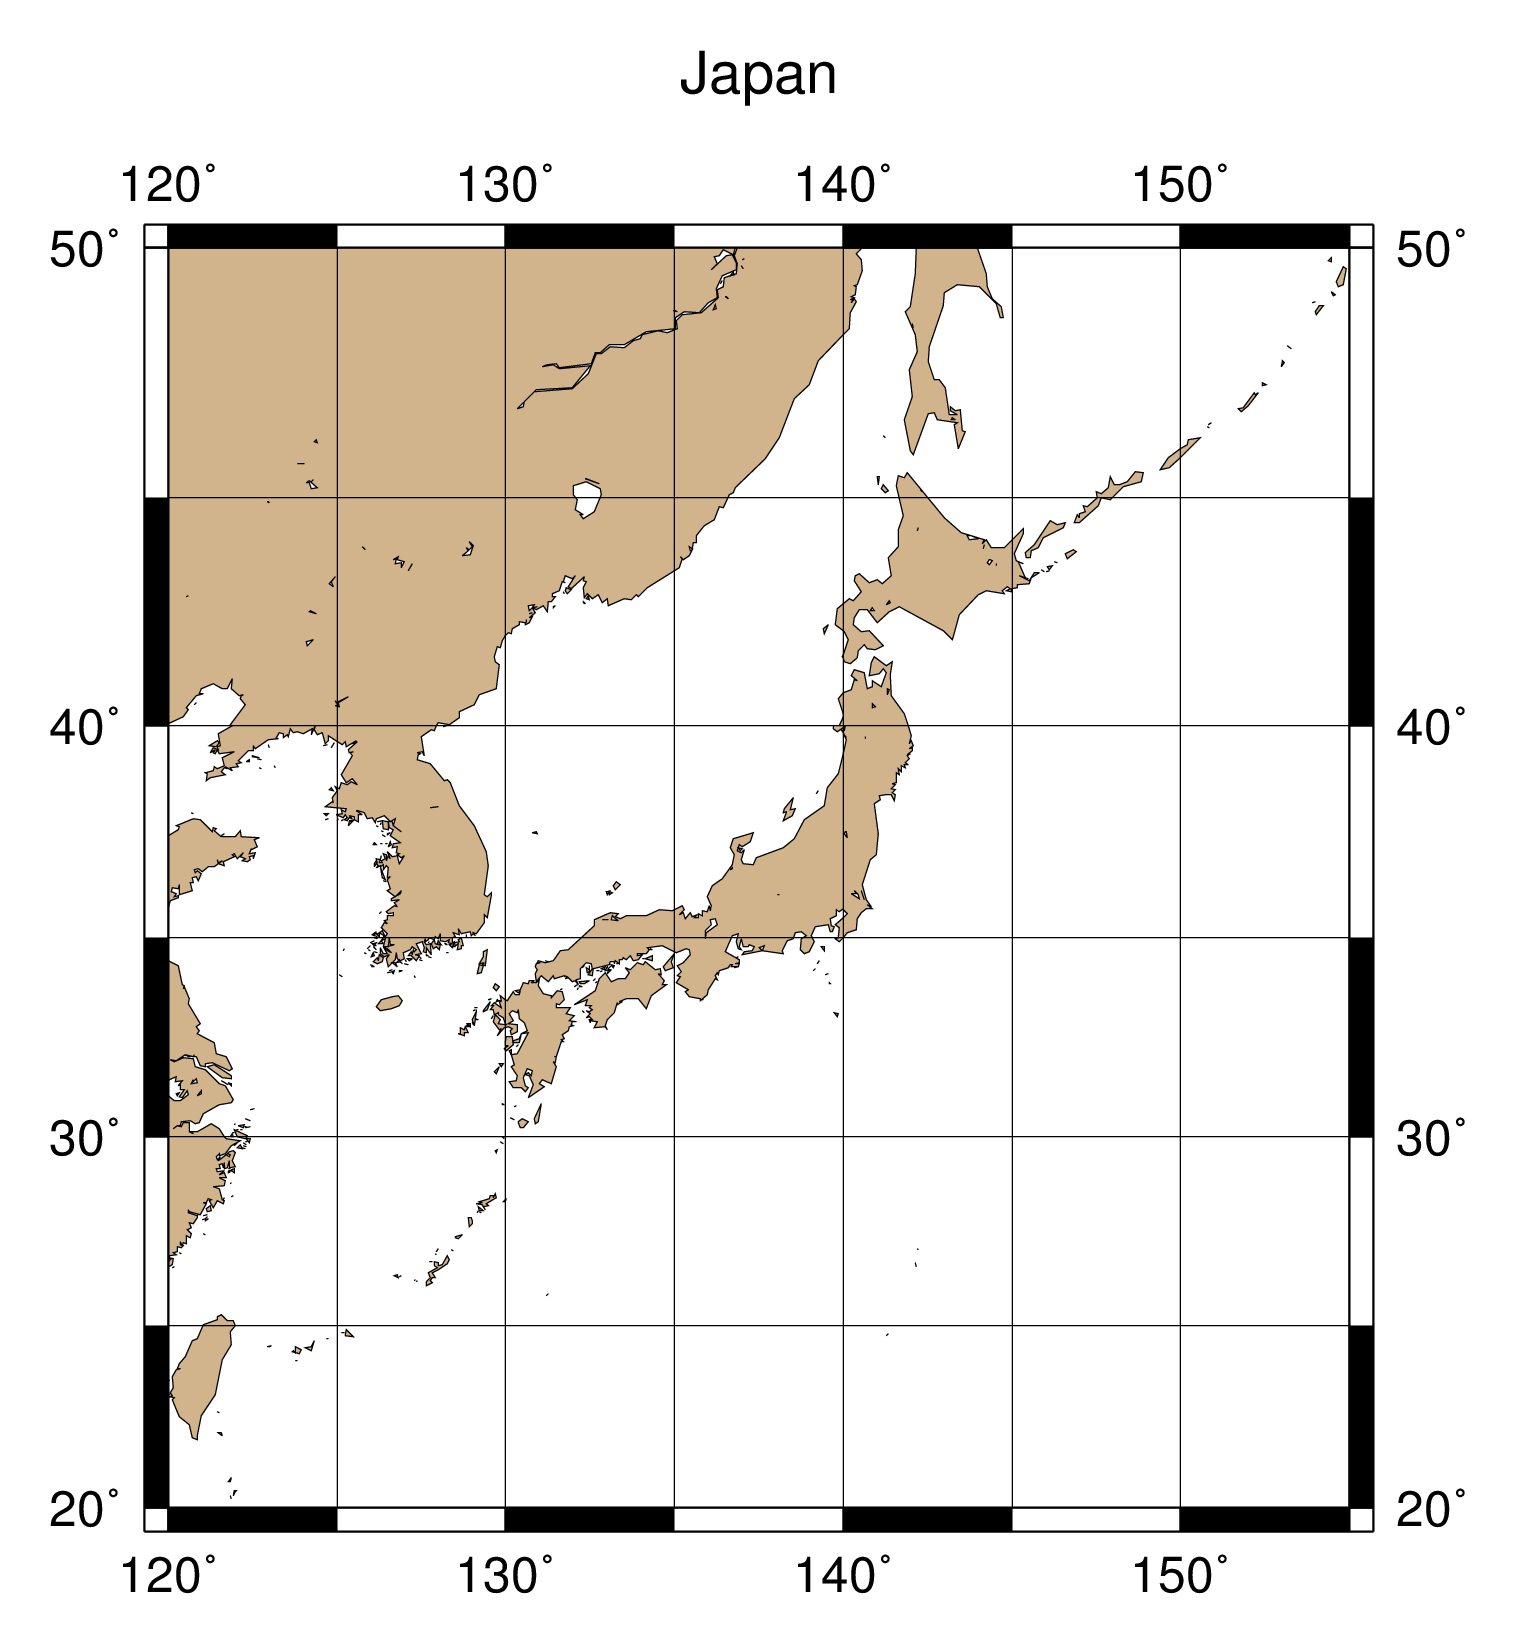
| fig_jmap0.png | Output image (blank map) |
| fig_jmap1.png | Output image (coastline) |
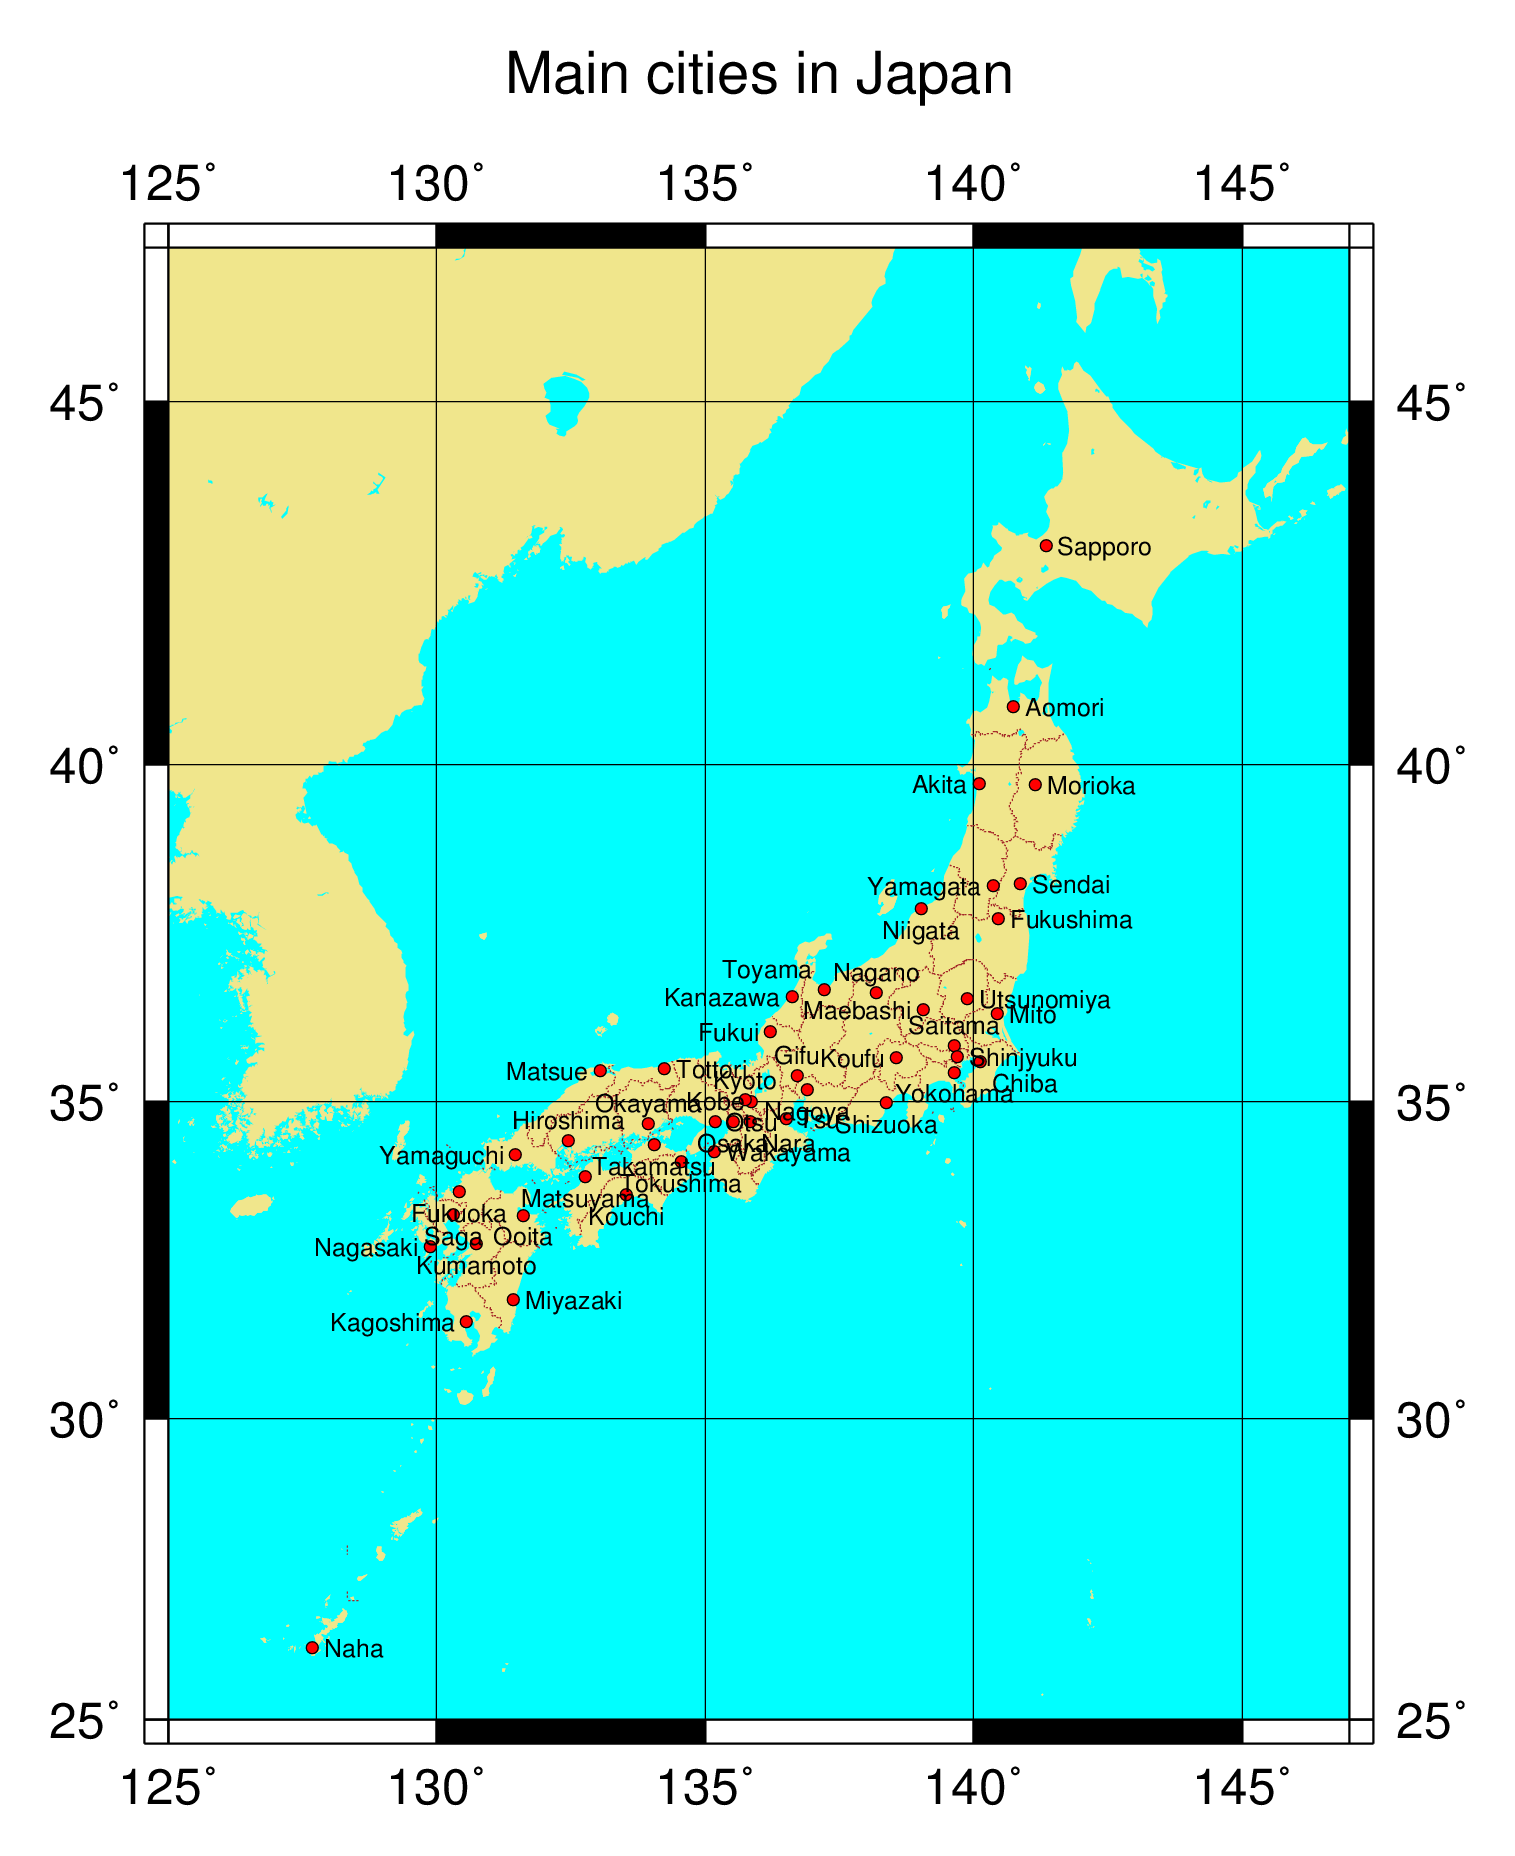
| fig_jmap2.png | Output image (location of main cities) |
| Filename | Description |
|---|---|
| bat_world.txt | Batch file for GMT execution |
| fig_world_M.png | Mercator Projection |
| fig_world_Q.png | Cylindrical Equidistant Projection |
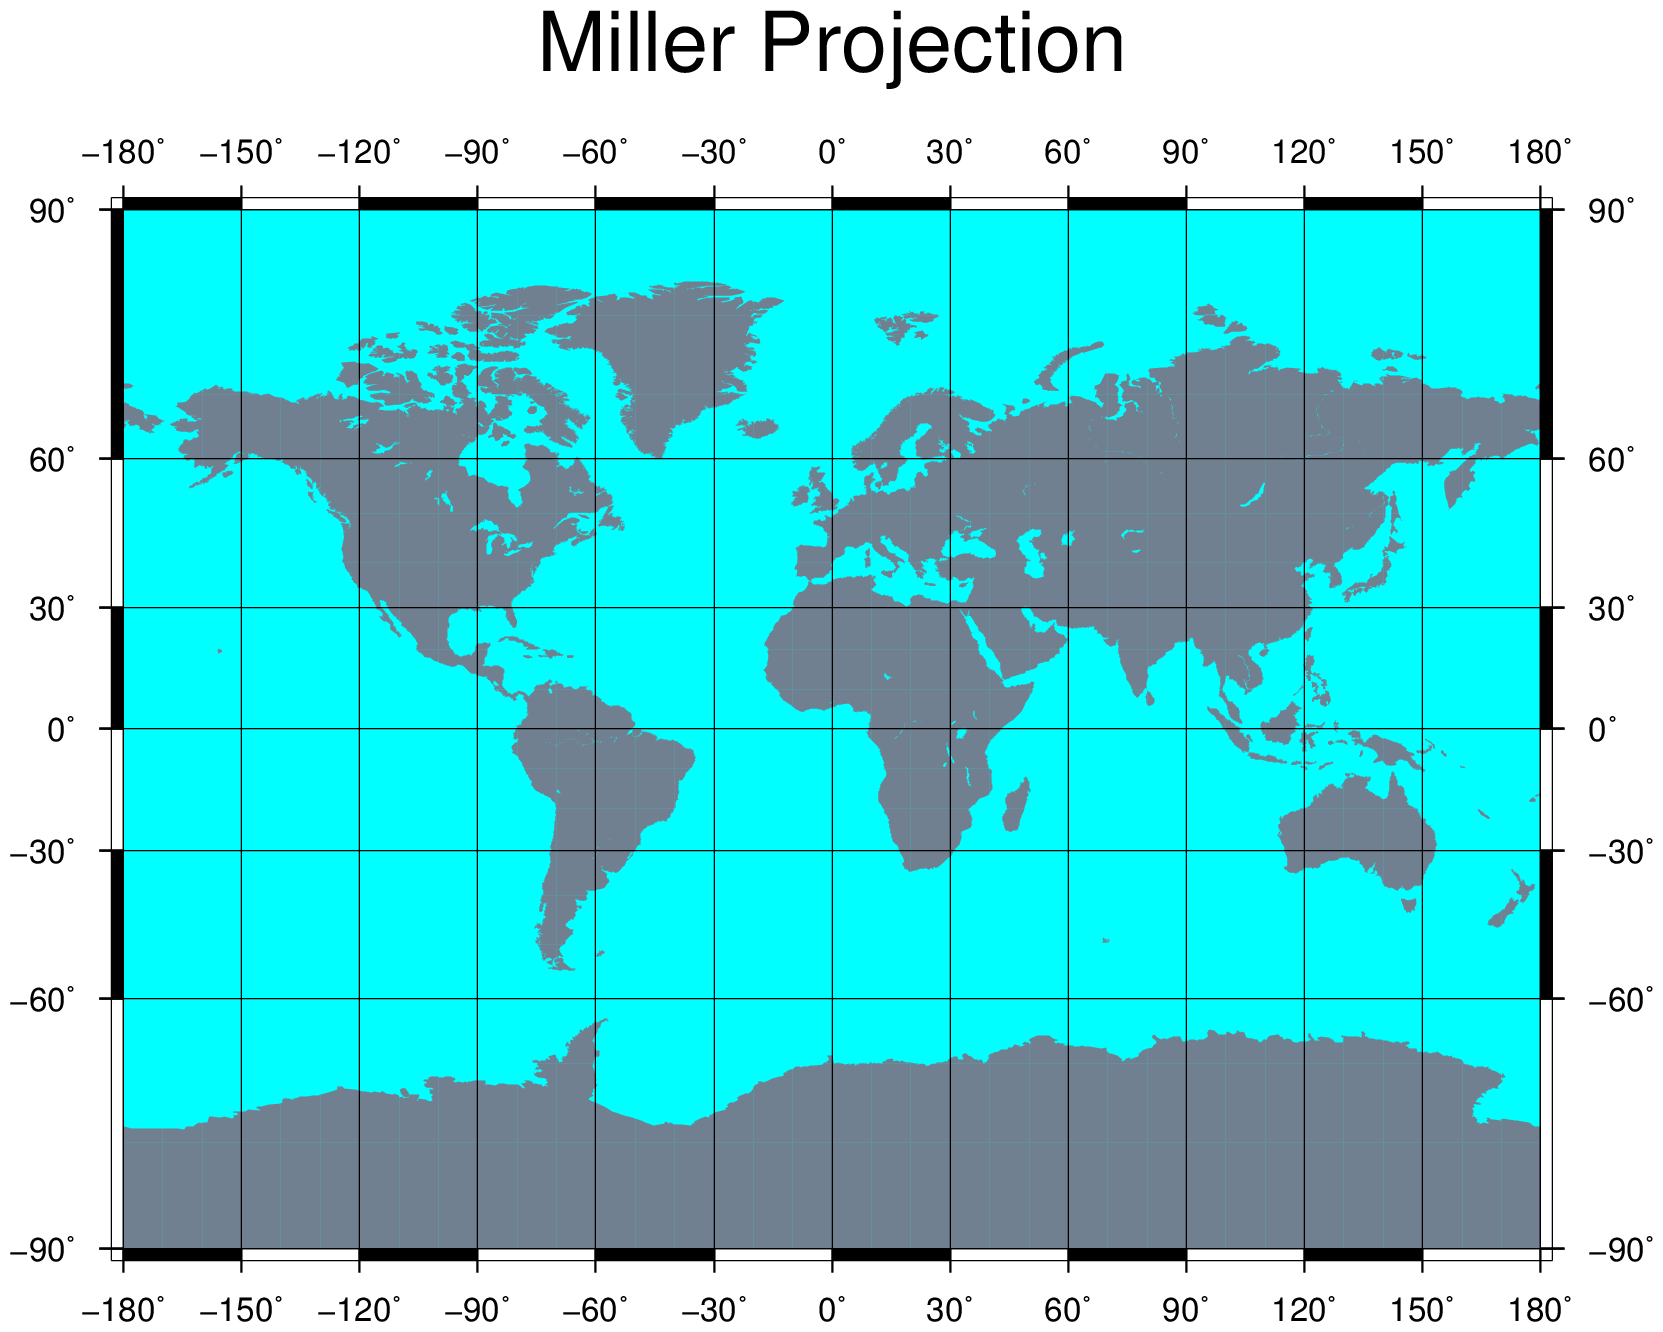
| fig_world_J.png | Miller Projection |
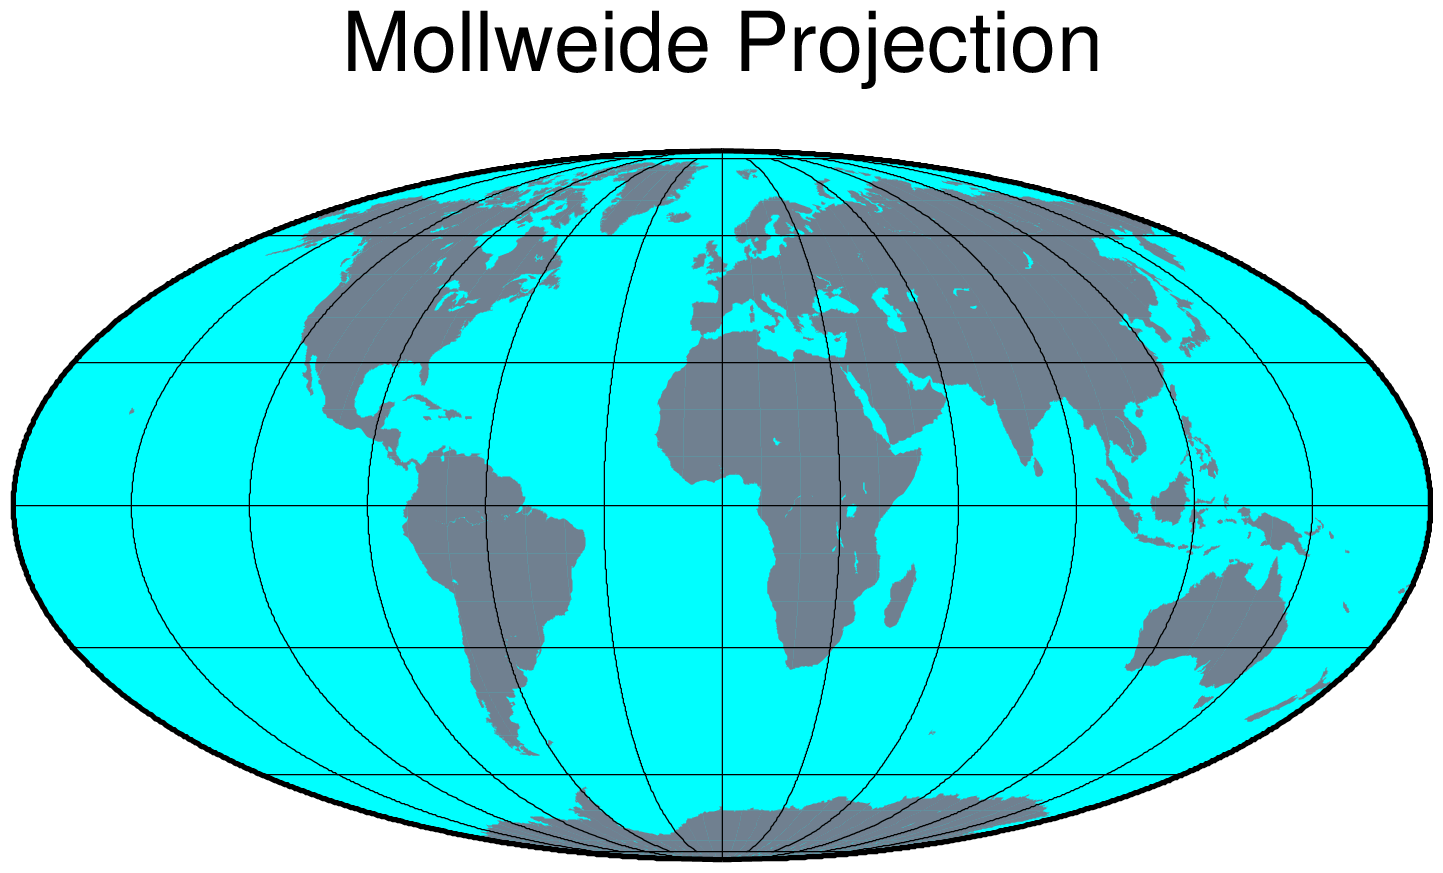
| fig_world_W.png | Mollweide Projection |
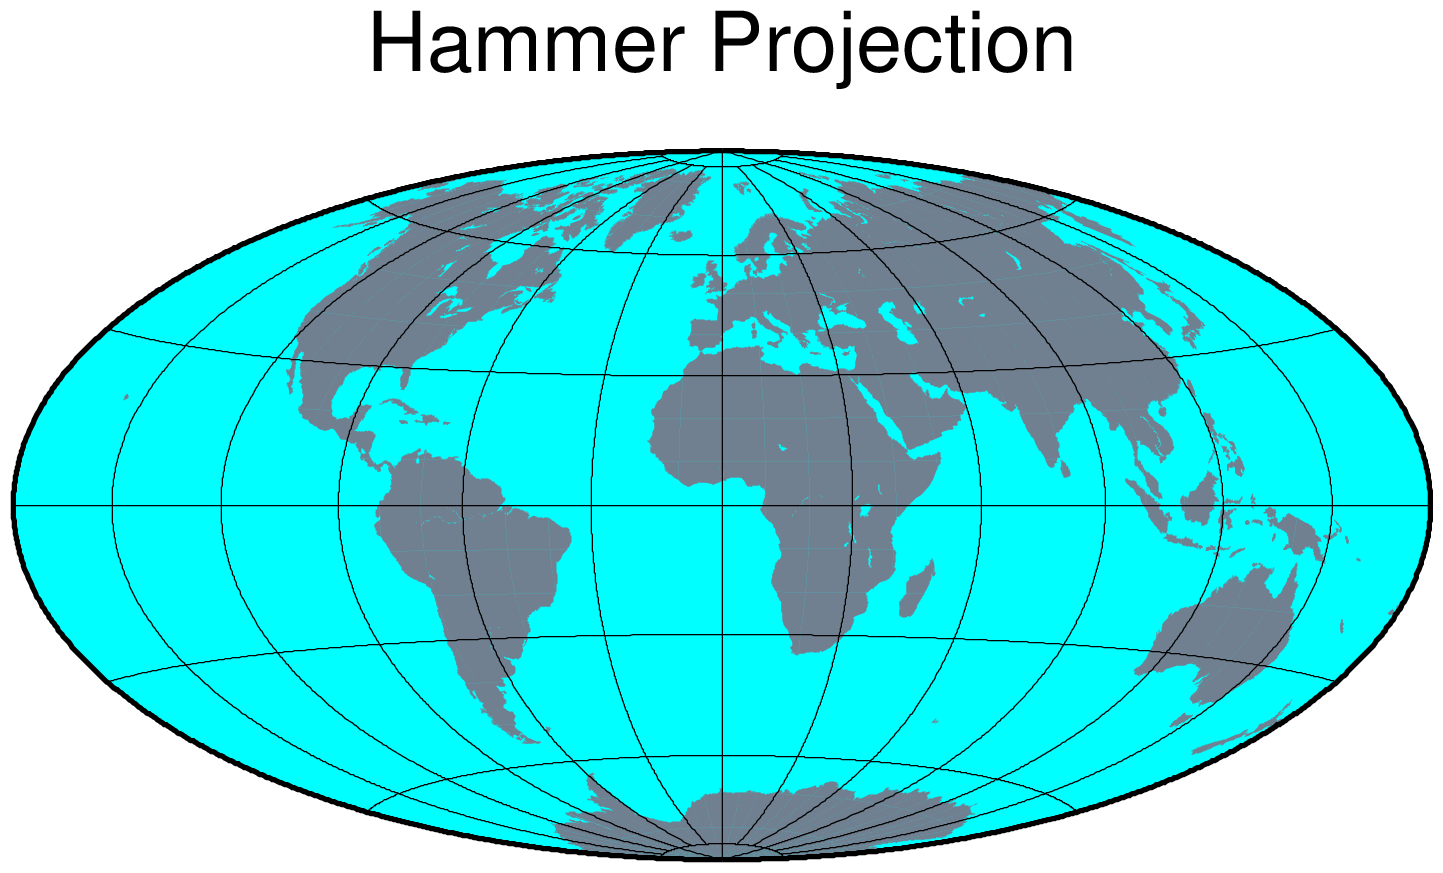
| fig_world_H.png | Hammer Projection |
| fig_world_Kf.png | Eckert IV Projection |
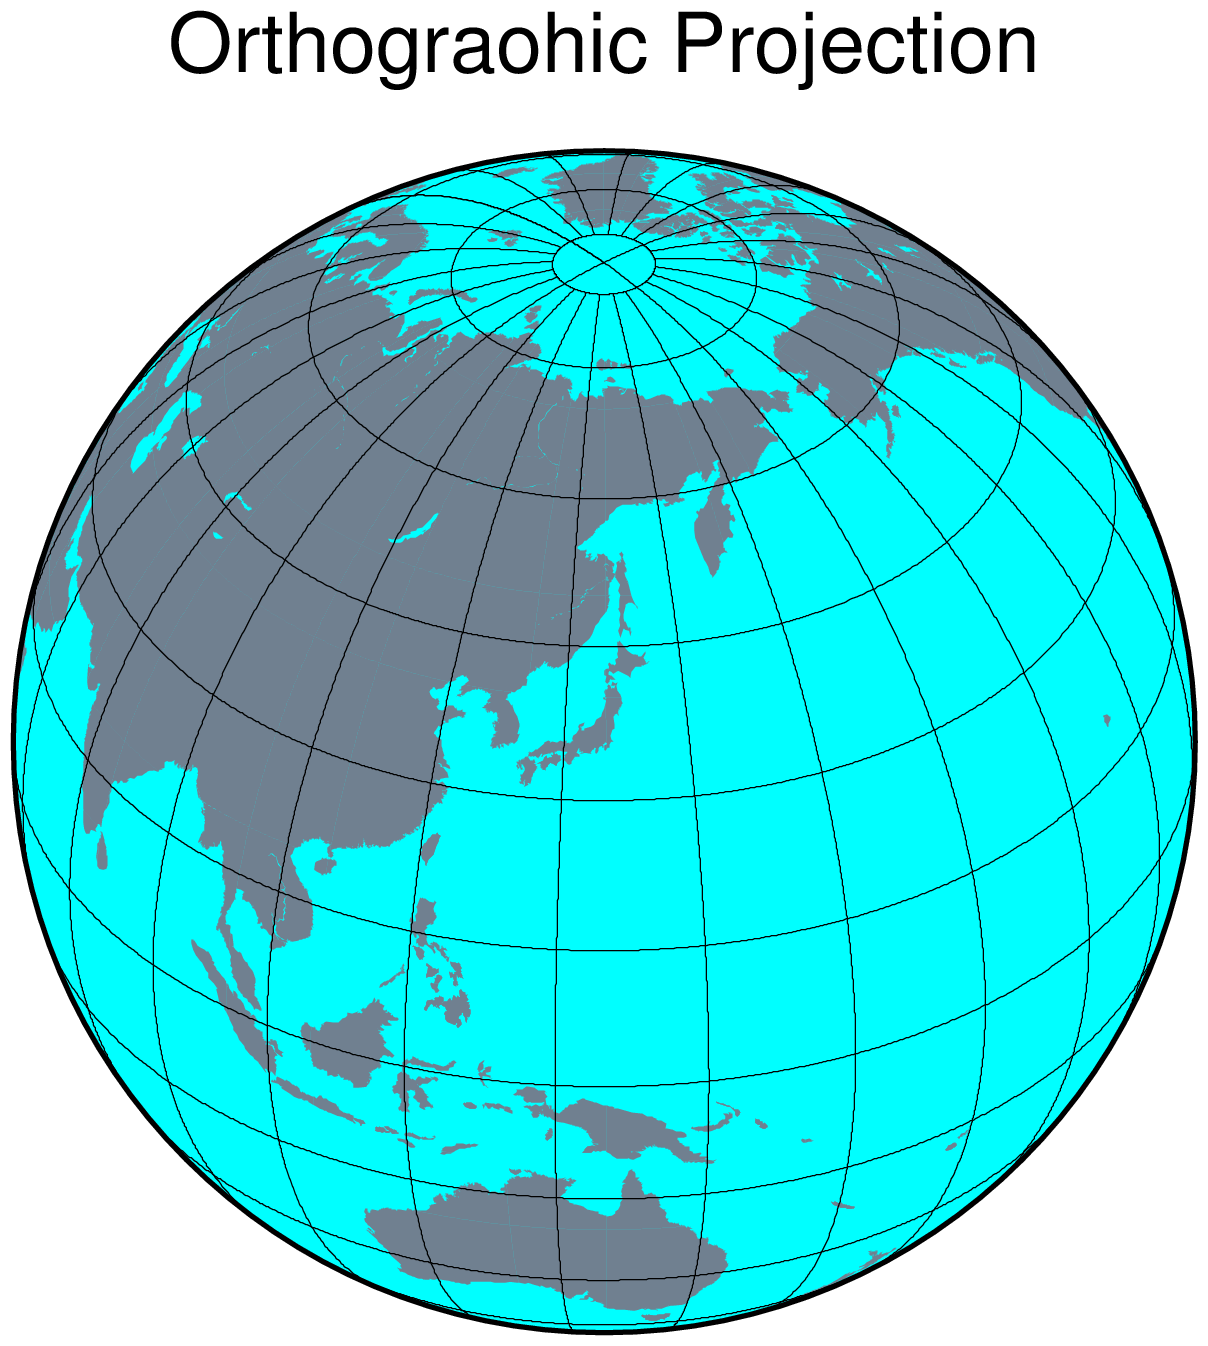
| fig_world_G_Tokyo.png | Orthographic Projection (centering Tokyo) |
| Filename | Description |
|---|---|
| bat_earth.txt | Batch file for GMT execution |
| inp_city.txt | Data of city coordinates for 'pstext' |
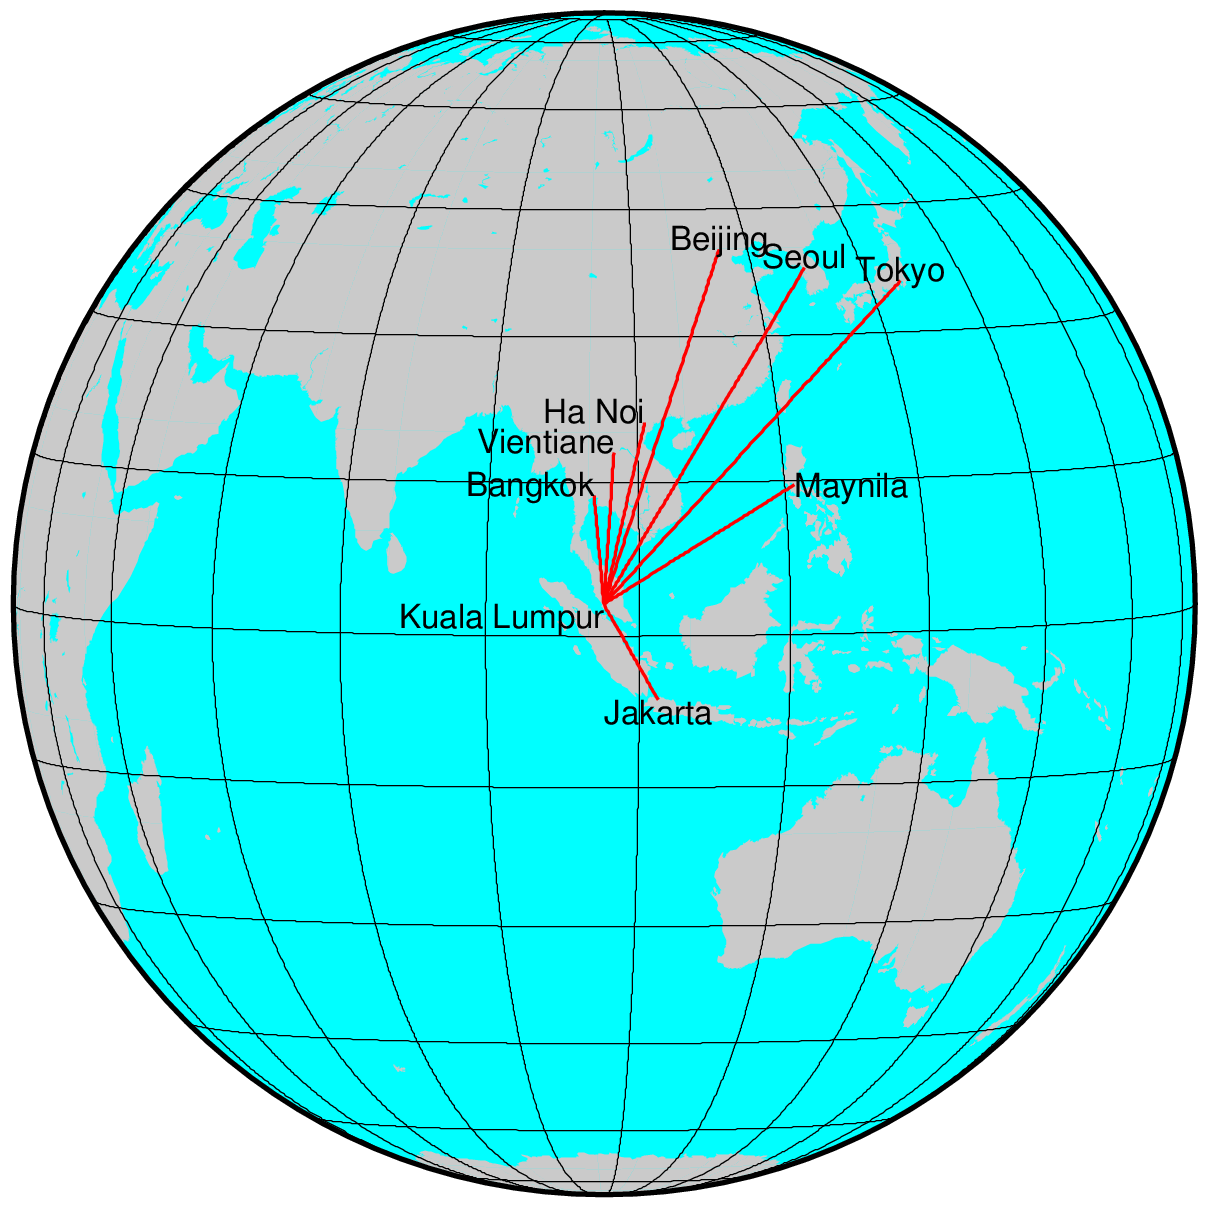
| inp_route.txt | Data of city coordinates for 'psxy' |
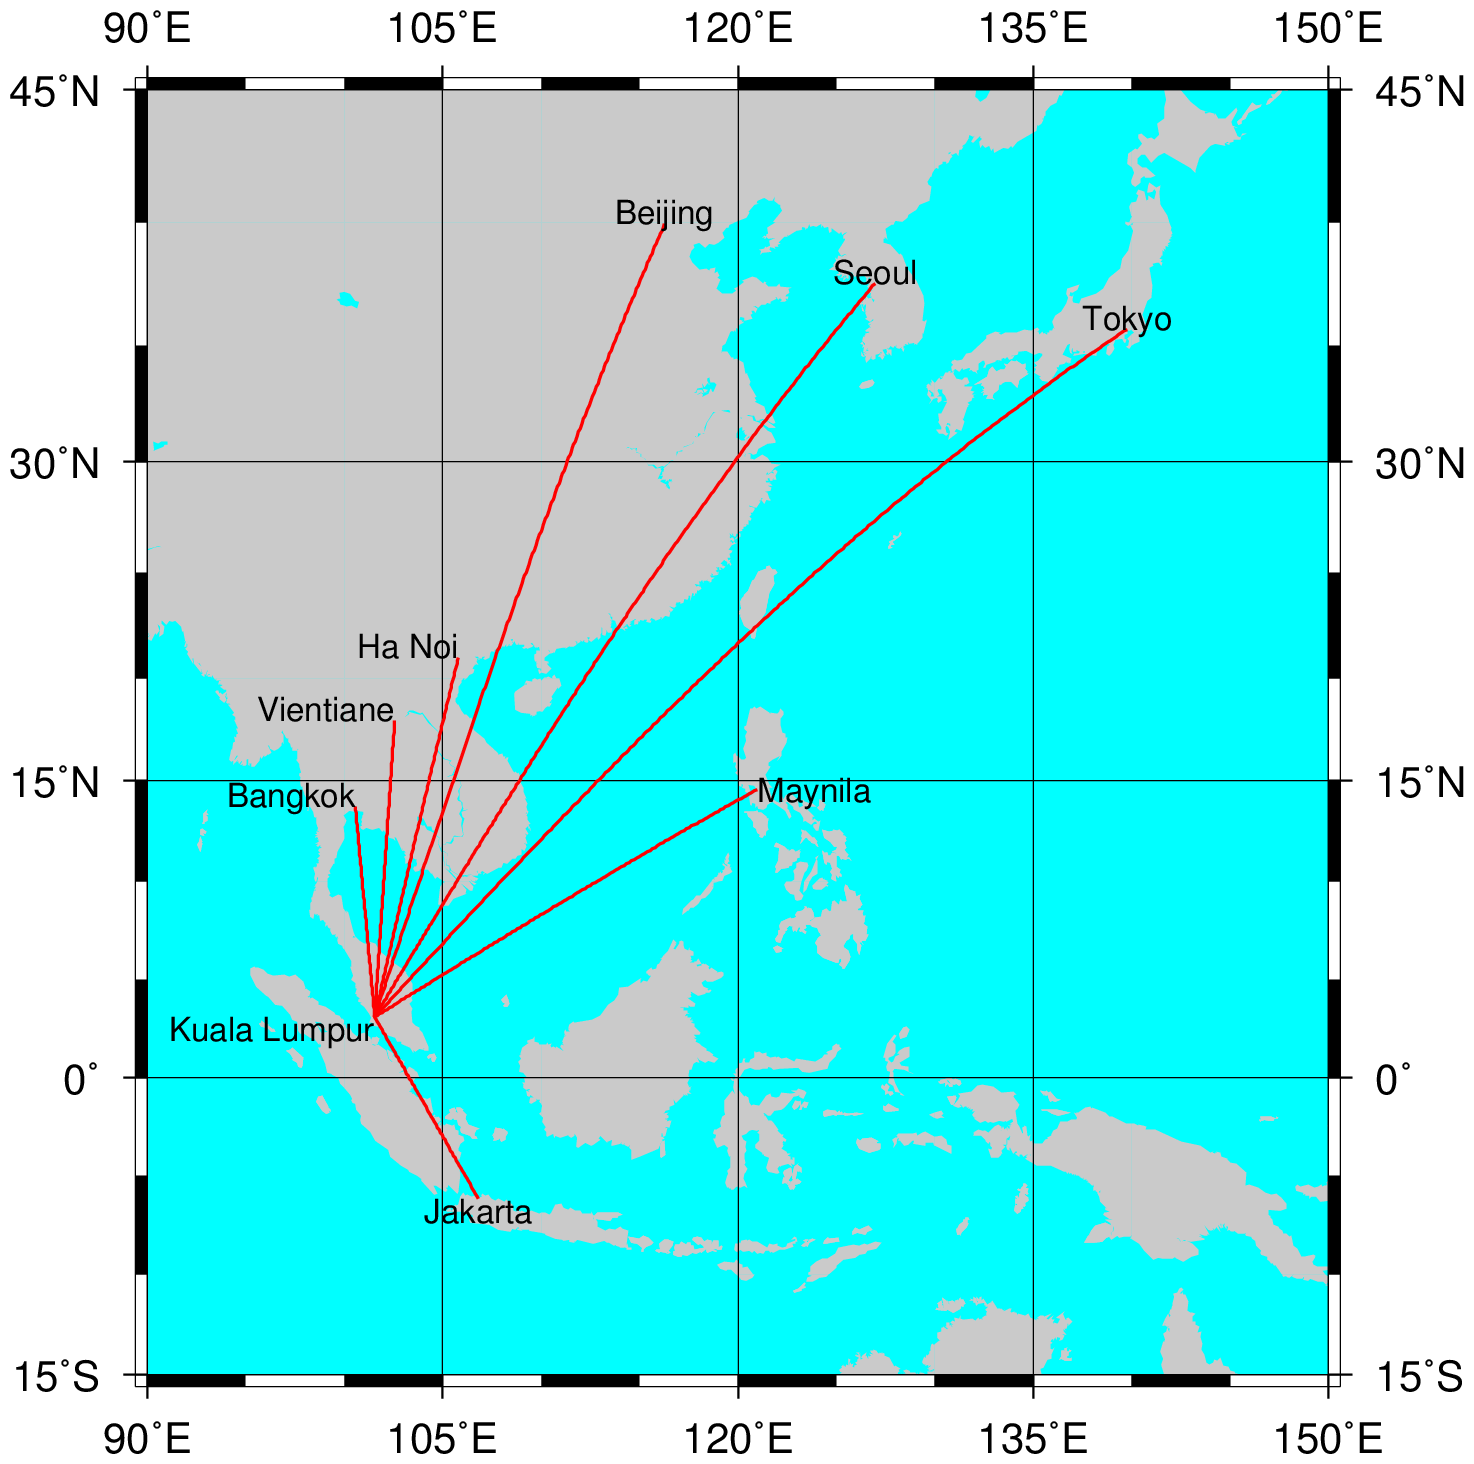
| fig_G_Malay.png | Orthographic Projection (centering Kuala Lumpur) |
| fig_M_easia.png | Mercator Projection of East Asia area |
| Filename | Description |
|---|---|
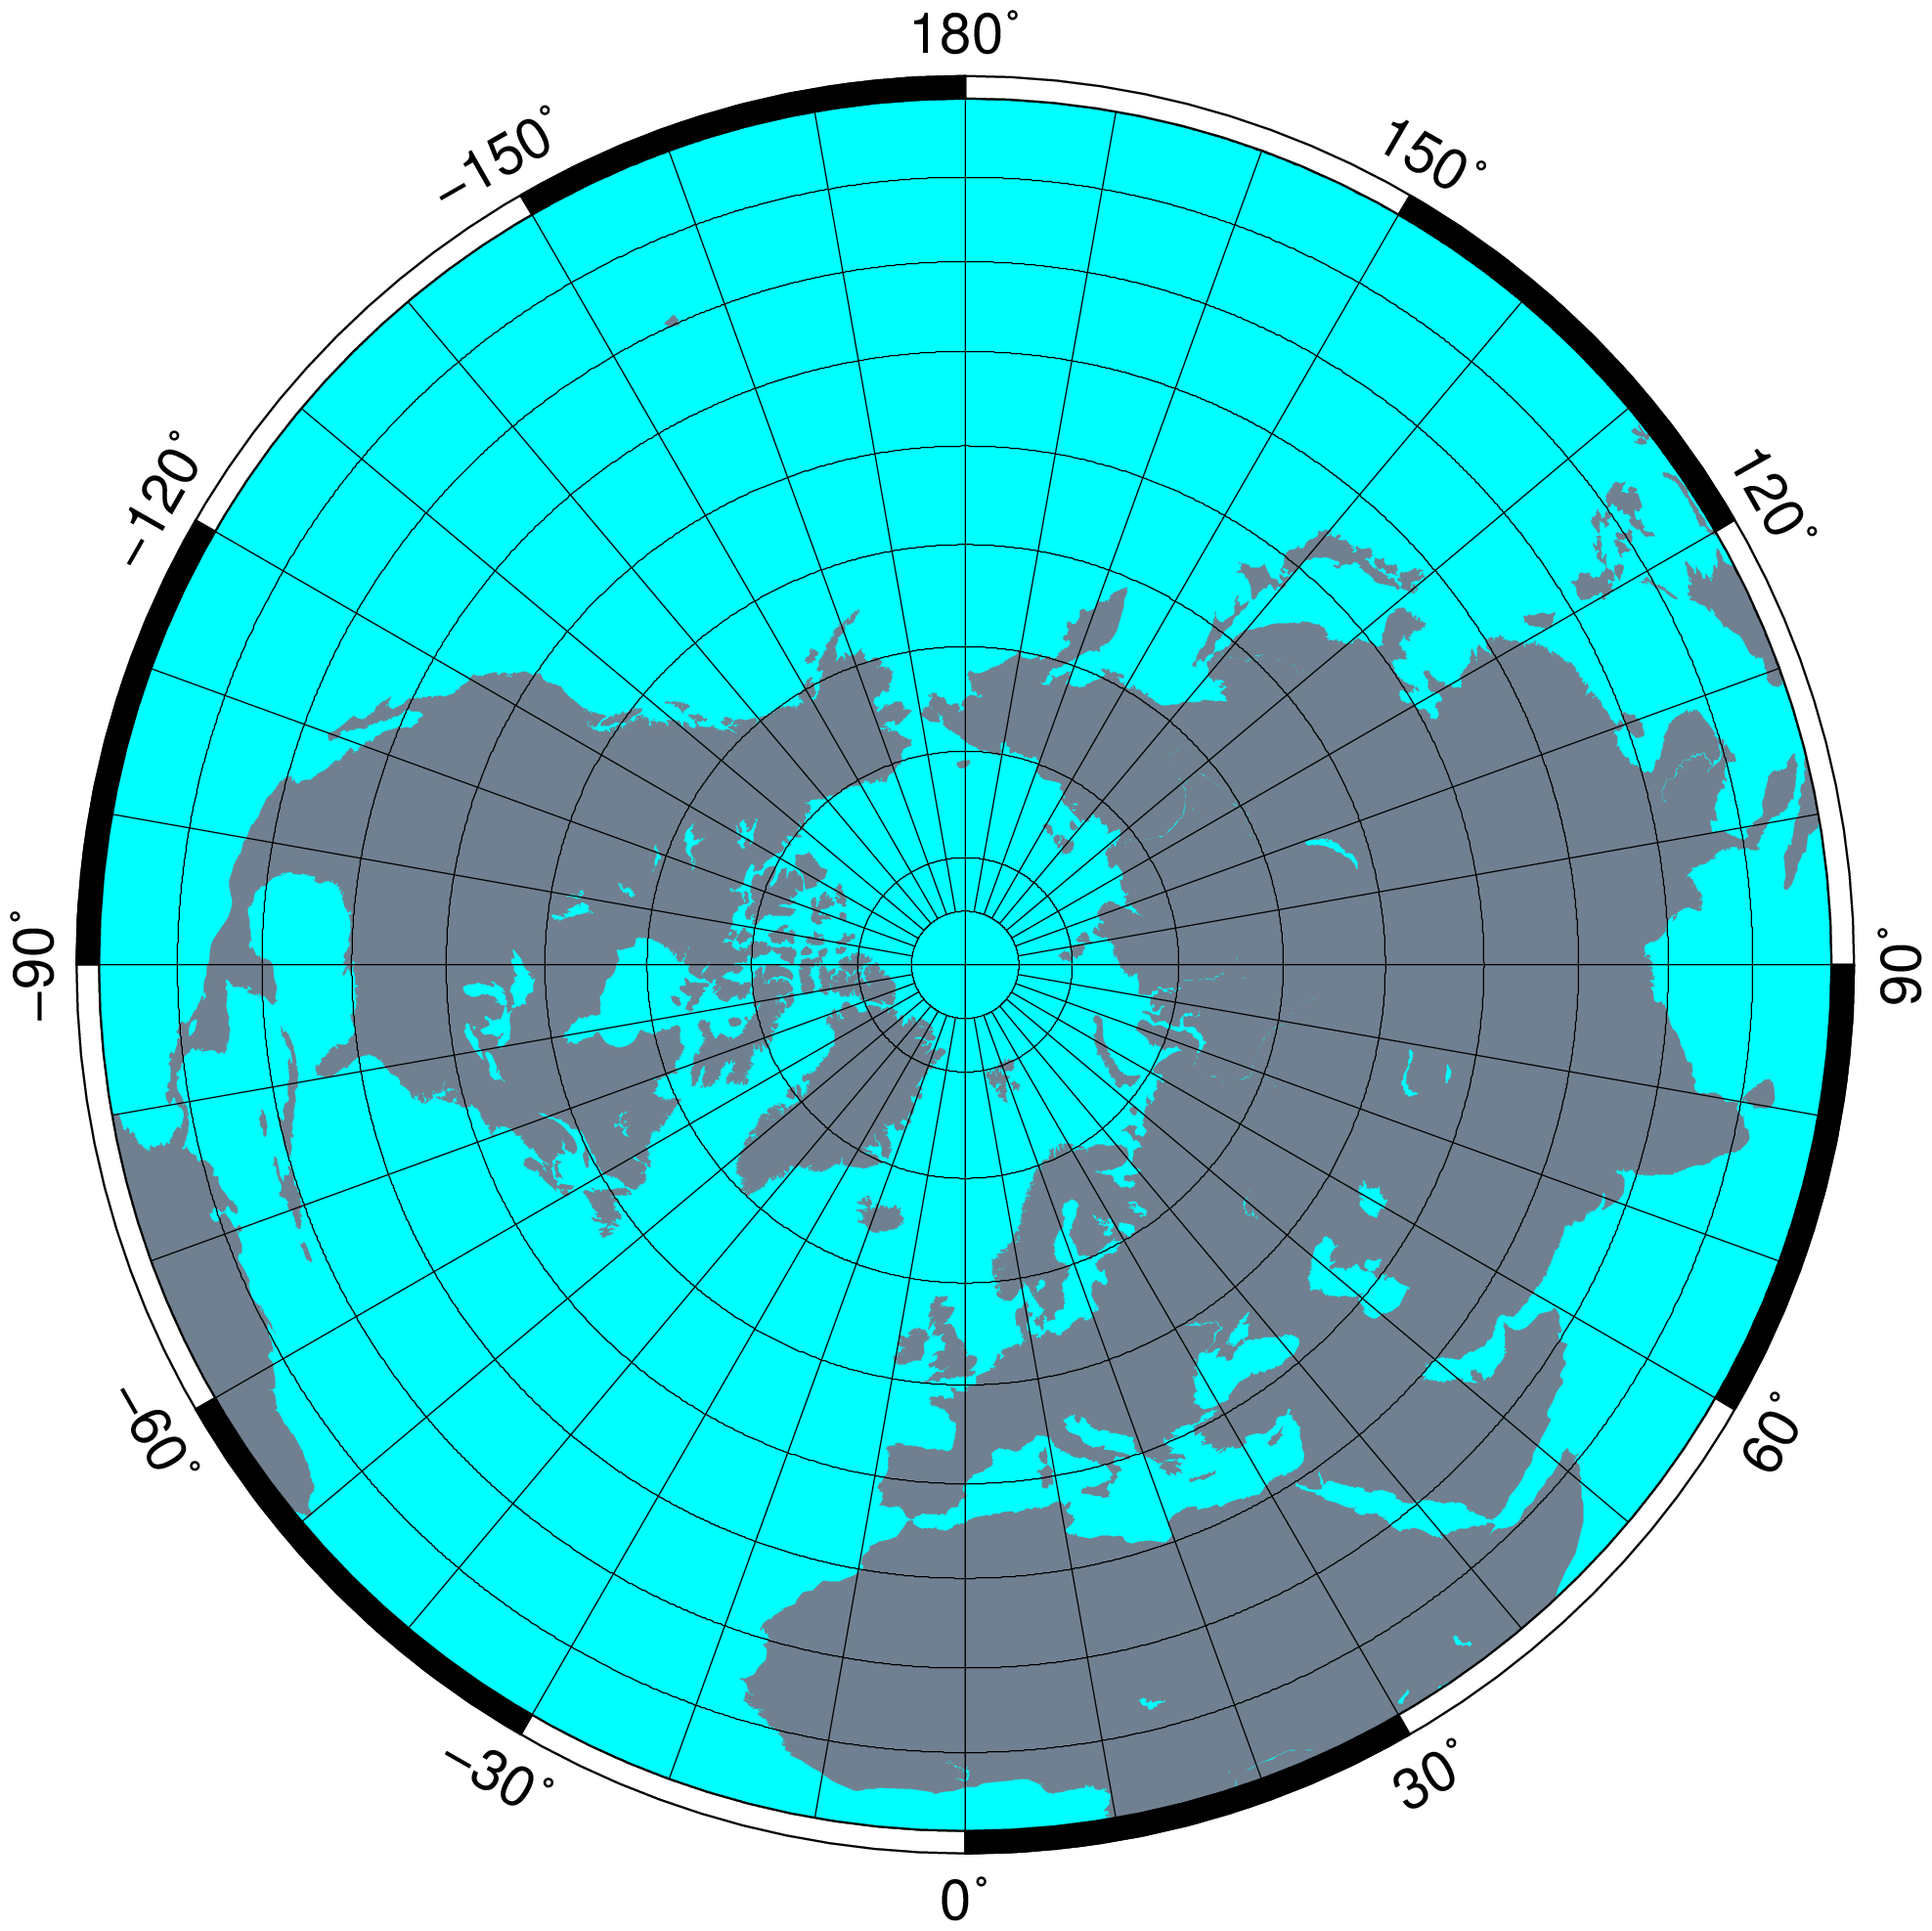
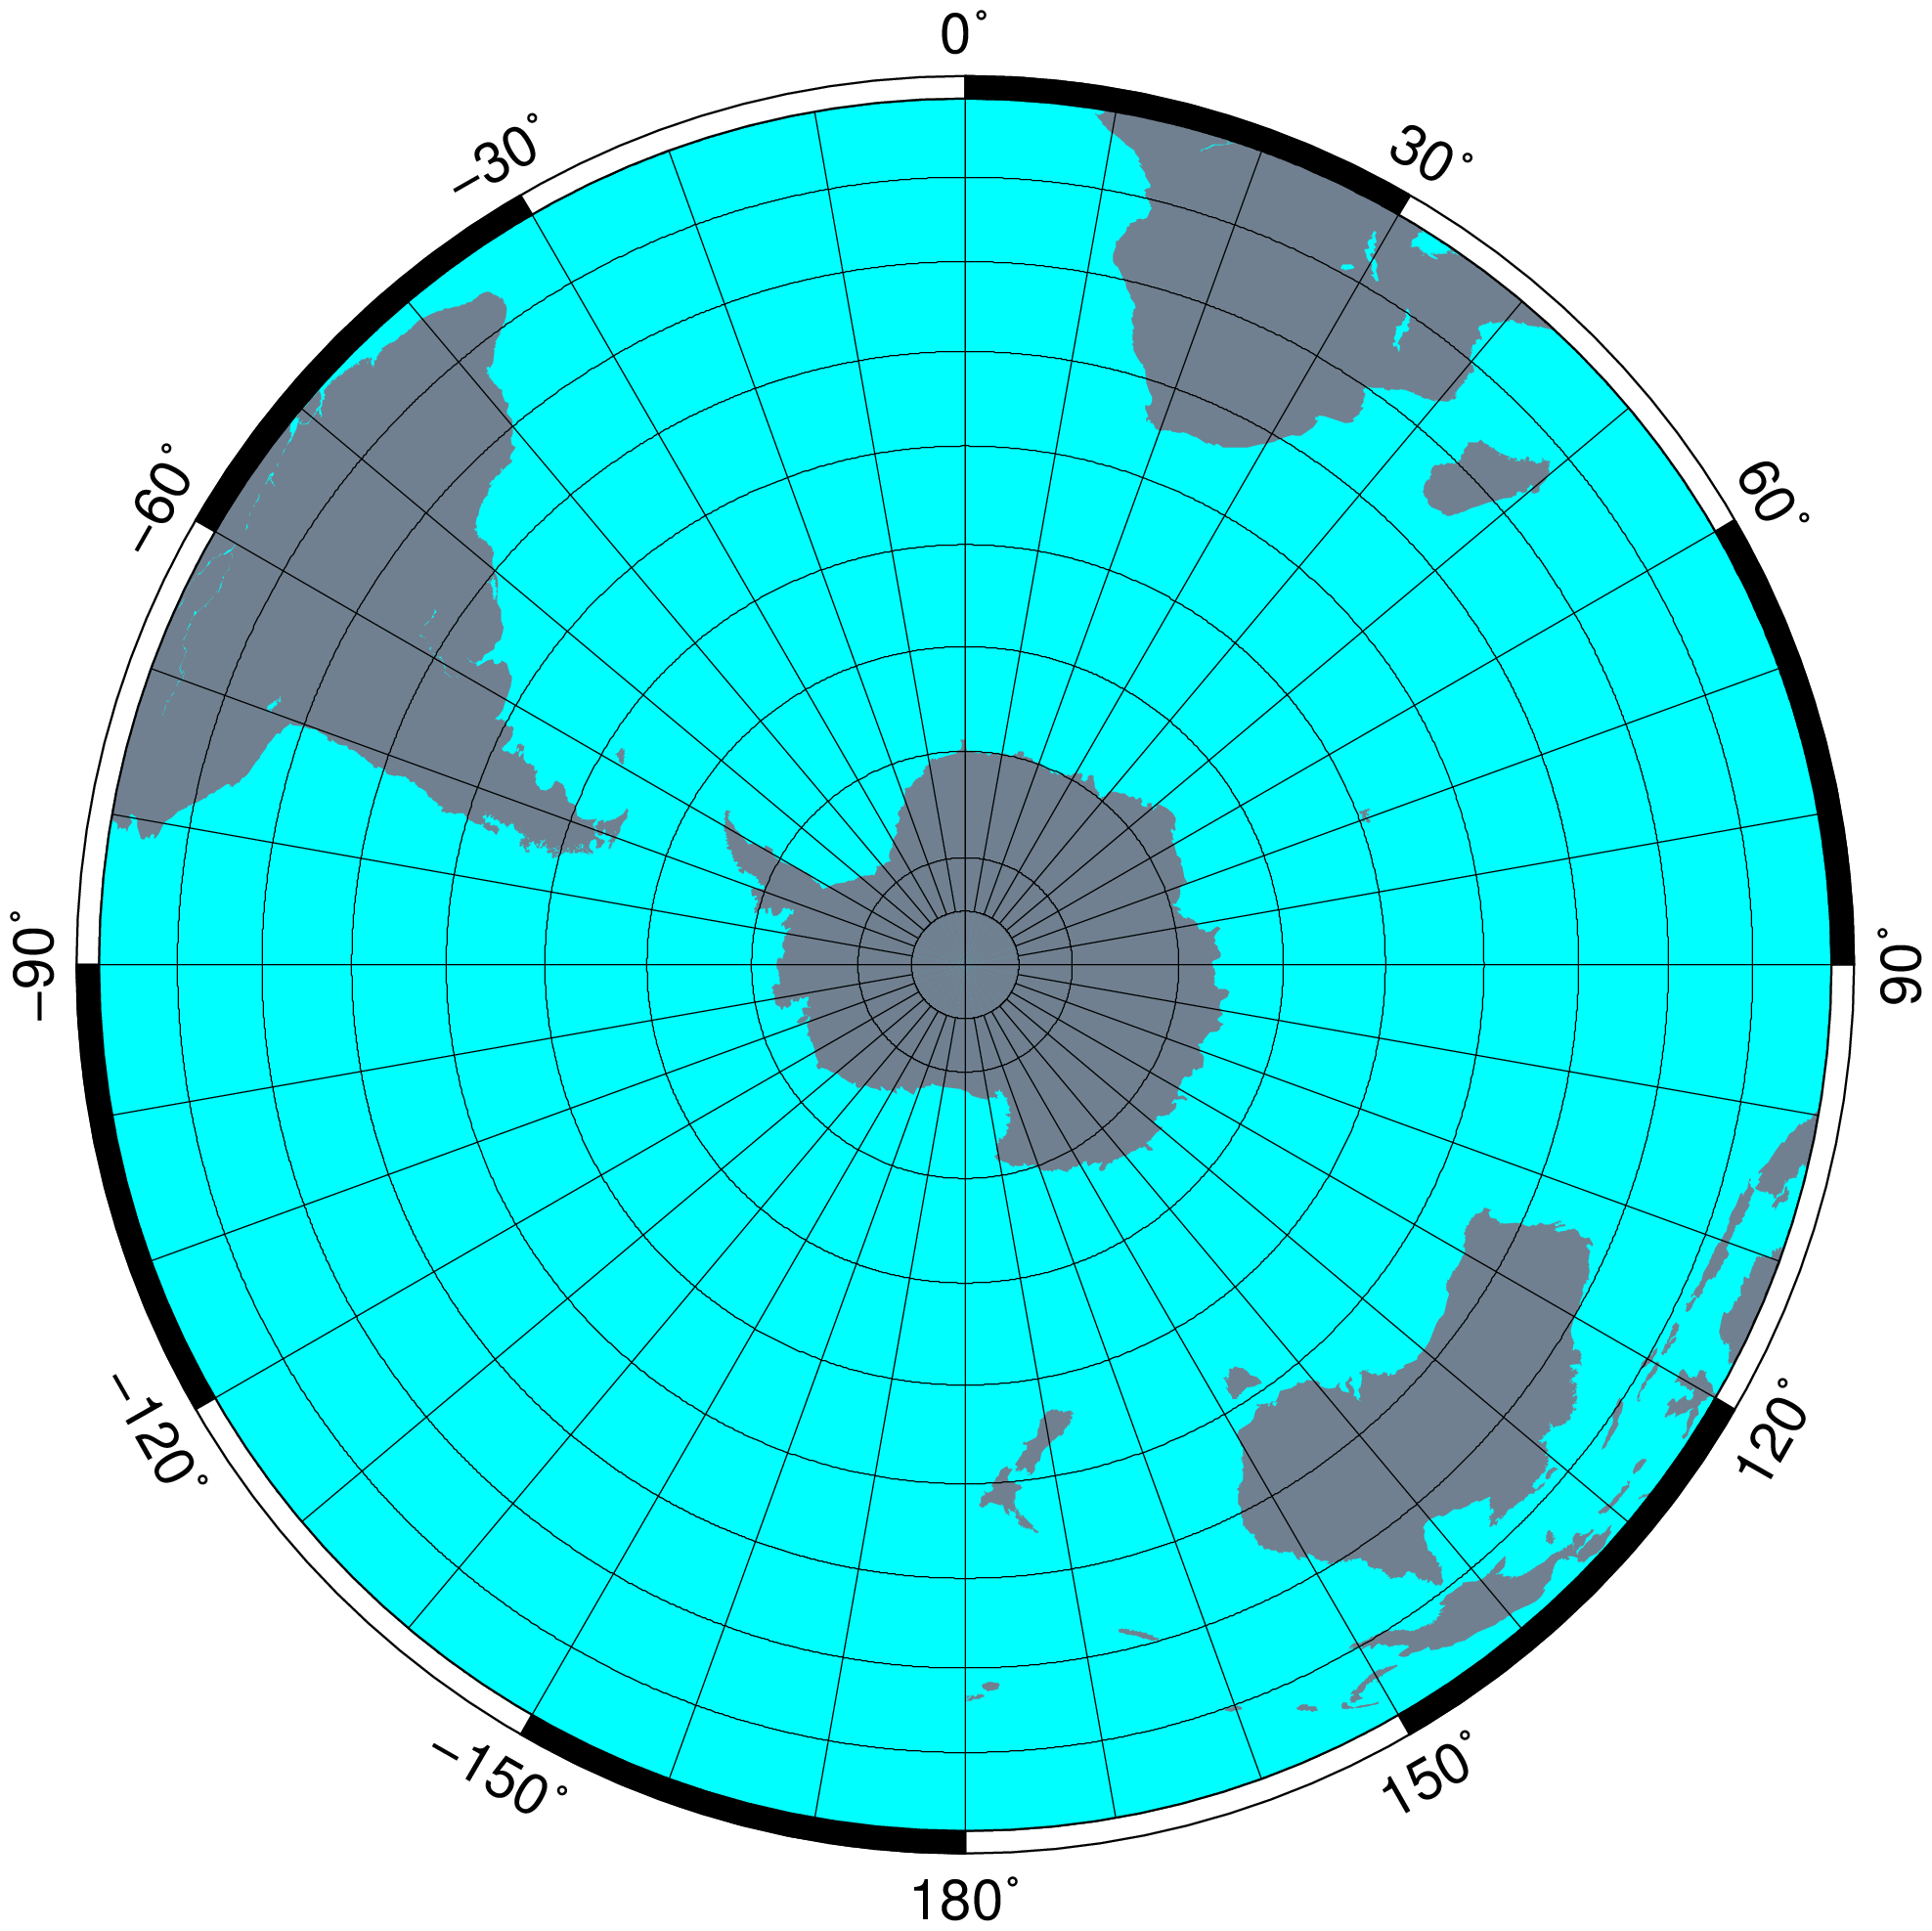
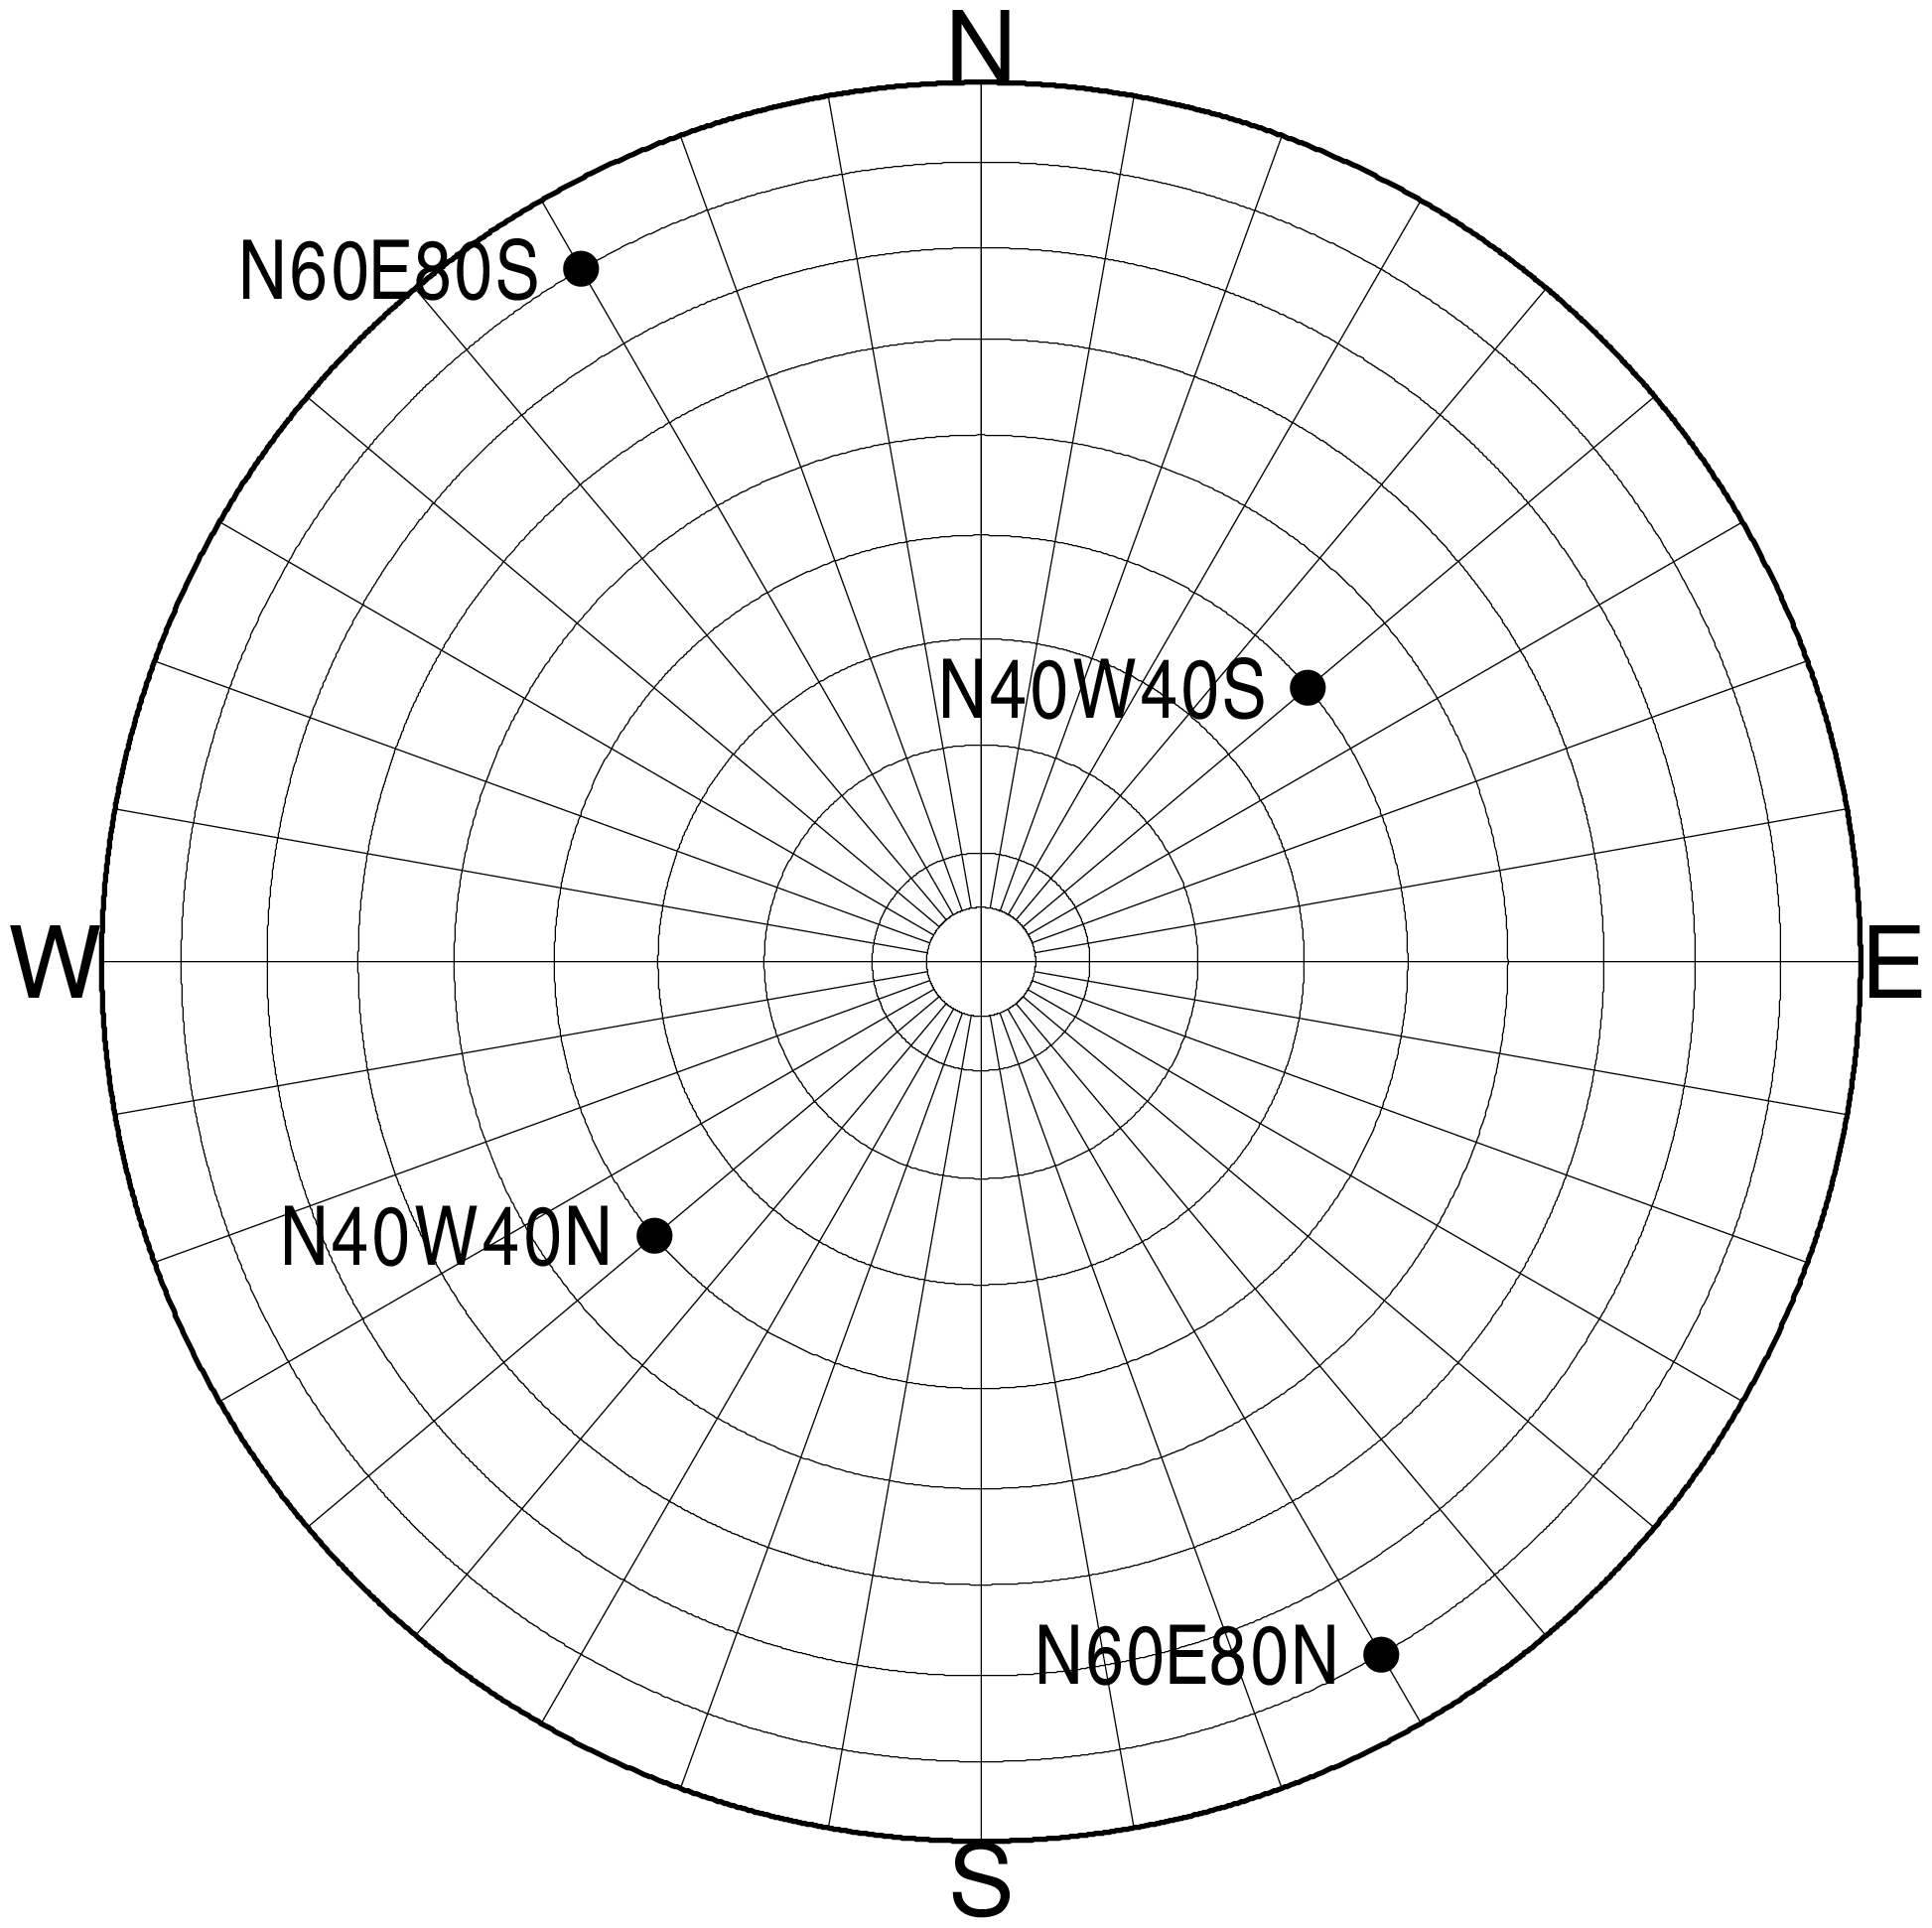
| bat_Lambert.txt | Batch file for GMT execution |
| fig_E_north.png | Output image (Northern hemisphere from North Pole) |
| fig_E_south.png | Output image (Southern Hemisphere from South Pole) |
| fig_schmidt.png | Output image (Schmidt net point diagram) |
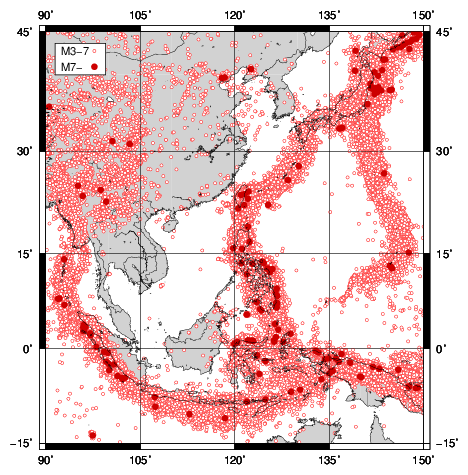
earthquake data was downloaded from website of USGS.
| USGS webpage |
Data format from USGS is shown below.
      Link to USGS Home Page


  NEIC: Earthquake Search Results


                    U.  S.  G E O L O G I C A L  S U R V E Y

                     E A R T H Q U A K E  D A T A  B A S E


 FILE CREATED:  Sun Oct 30 05:53:38 2011
 Global Search   Earthquakes=    383175
 Catalog Used: PDE
 Date Range:   1900/01/01   to    2011/10/31
 Magnitude Range:   3.0  -  10.0
 Depth Range:    0  -  100
 Data Selection: Historical & Preliminary Data


 CAT    YEAR  MO DA  ORIG TIME   LAT    LONG  DEP  MAGNITUDE  IEM DTSVNWG DIST
                                                              NFO          km
                                                              TF

 PDE    1973  01 01 034609.80  -9.21  150.63  41  5.3 mbGS    ... .......
 PDE    1973  01 01 052229.80 -15.01 -173.96  33  5.0 mbGS    ... .......
 PDE    1973  01 01 114237.50 -35.51  -16.21  33  6.0 MsGS    ... .......
.......... .......... ..........
 PDE-Q  2011  10 28 084809.40  38.49   43.77  10  4.6 mbGS    ... .......
 PDE-Q  2011  10 28 090837.95 -40.63  126.42  10  4.7 mbGS    ... .......
 PDE-Q  2011  10 28 091846.27  35.53  -97.37   5  3.5 LgGS    ... .......

------------------------------------------------------------------------

*USGS National Earthquake Information Center*
USGS Privacy Statement  | Disclaimer
FirstGov | Filename | Description |
|---|---|
| a.txt | Batch file to execute awk script |
| awk_choice.txt | Awk script to find specified data |
| awk_klegend.txt | Awk script for legend drawing by GMT |
| bat_wg_eqcoast.txt | Batch file for GMT execution |
| fig_gmt_eq_east.png | Output image |
(Note) Input data for legend drawing is created in the batch file for GMT execution.
| Filename | Description |
|---|---|
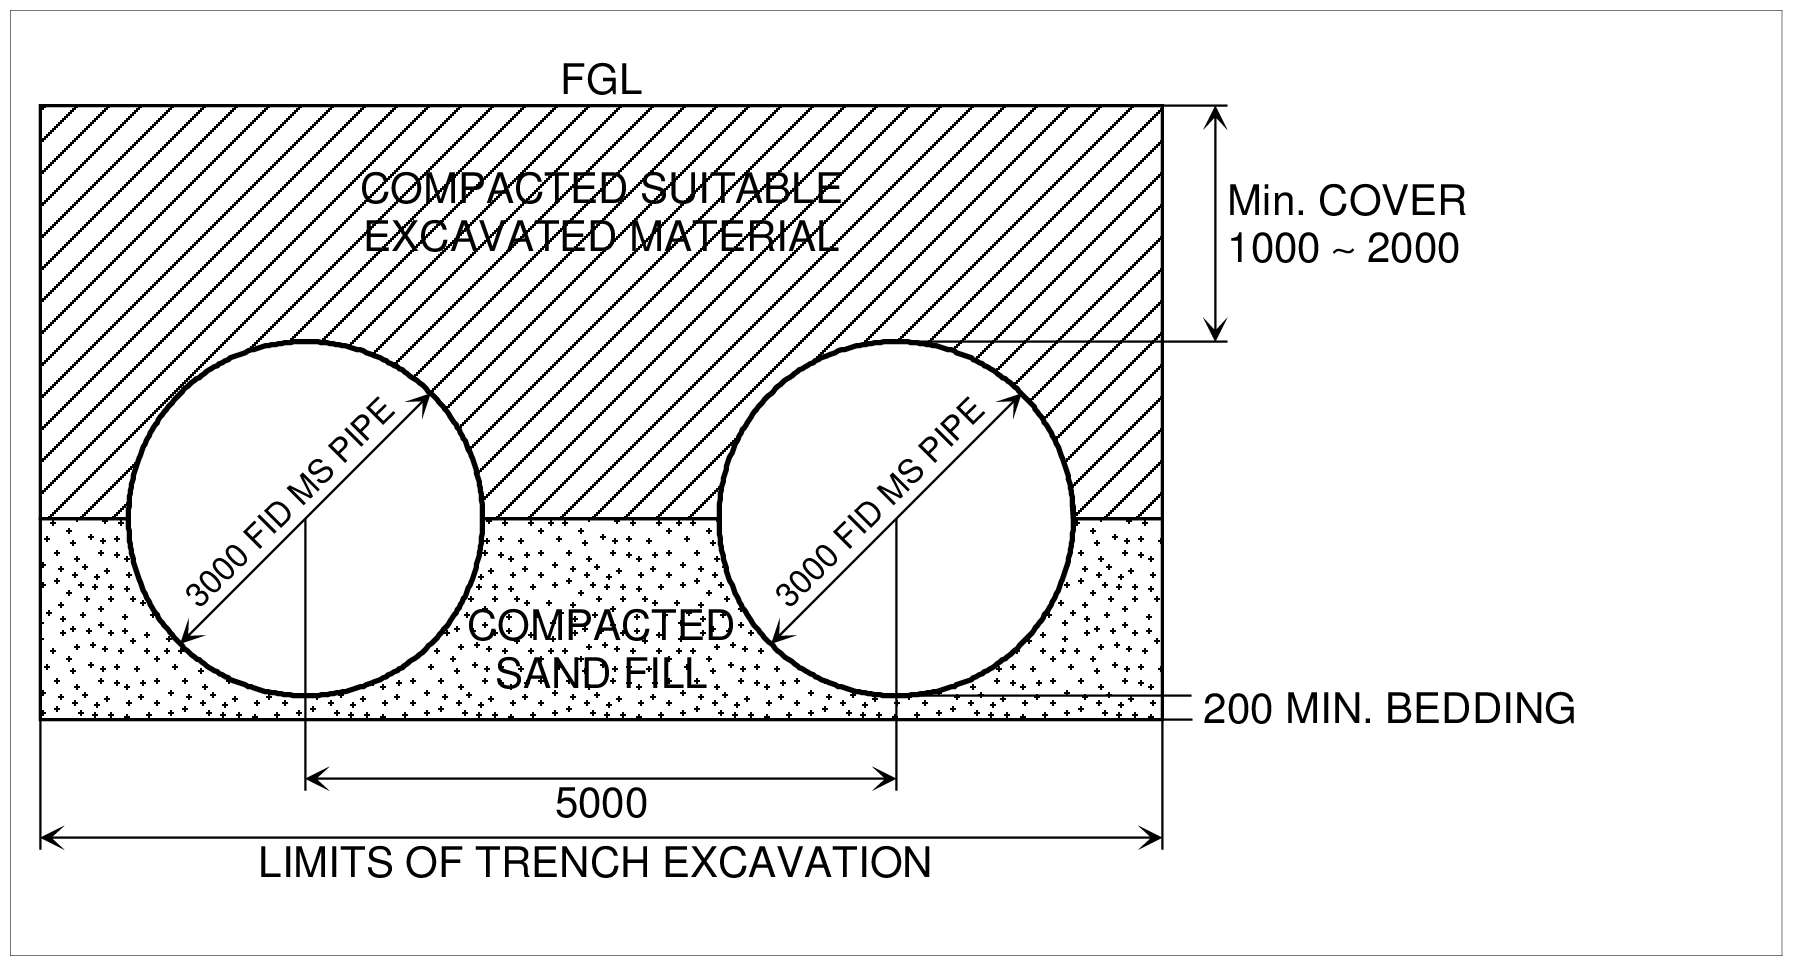
| bat_backfill.txt | batch file for GMT execution |
| fig_gmt_pipe.png | Output image (sample use of hachure patterns) |
| Filename | Description |
|---|---|
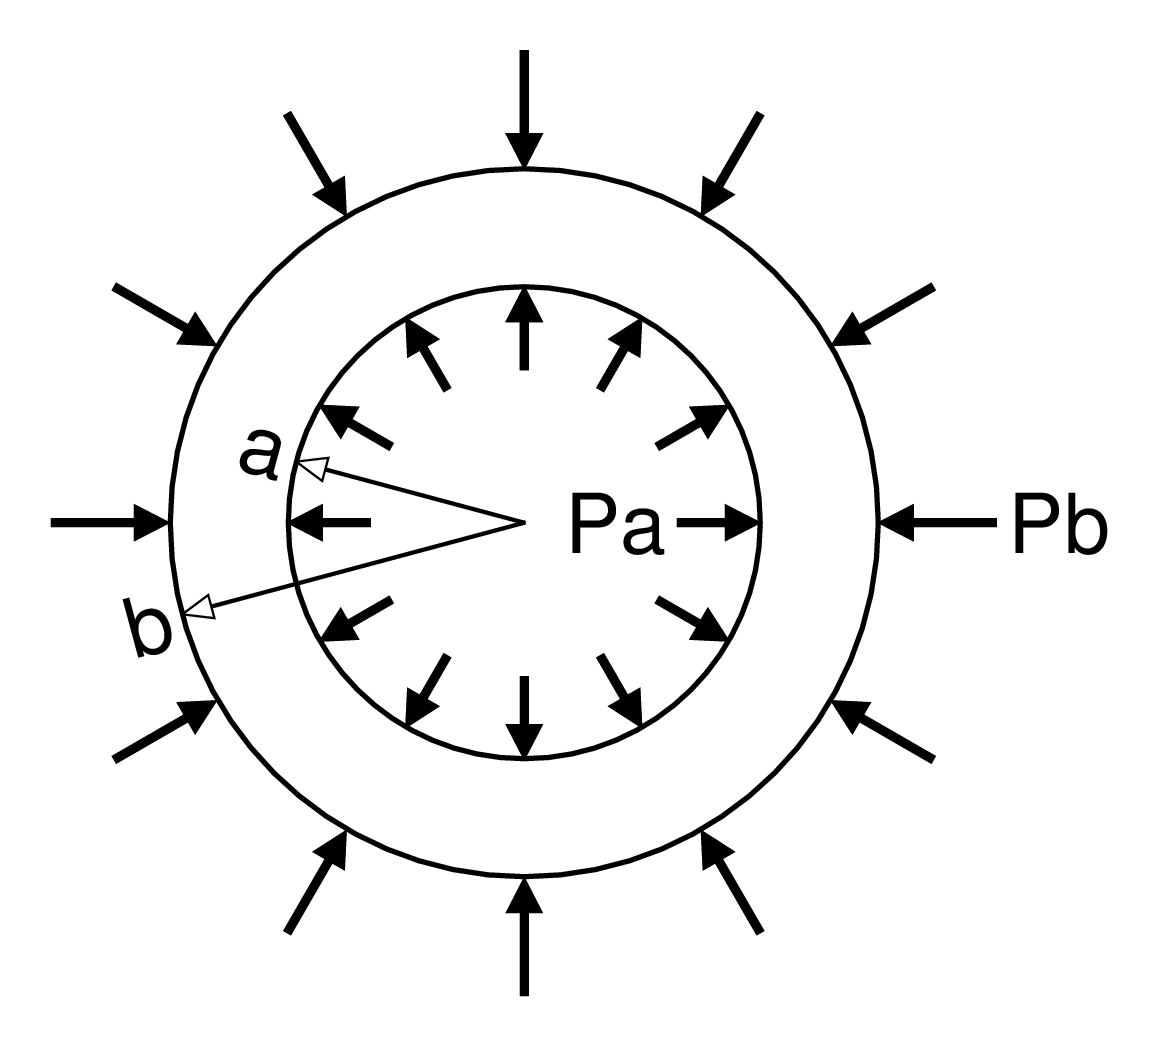
| bat_shell_1.txt | batch file for GMT execution 1 |
| bat_shell_2.txt | batch file for GMT execution 2 |
| fig_shell_1.png | Output image 1 |
| fig_shell_2.png | Output image 2 |
| Filename | Description |
|---|---|
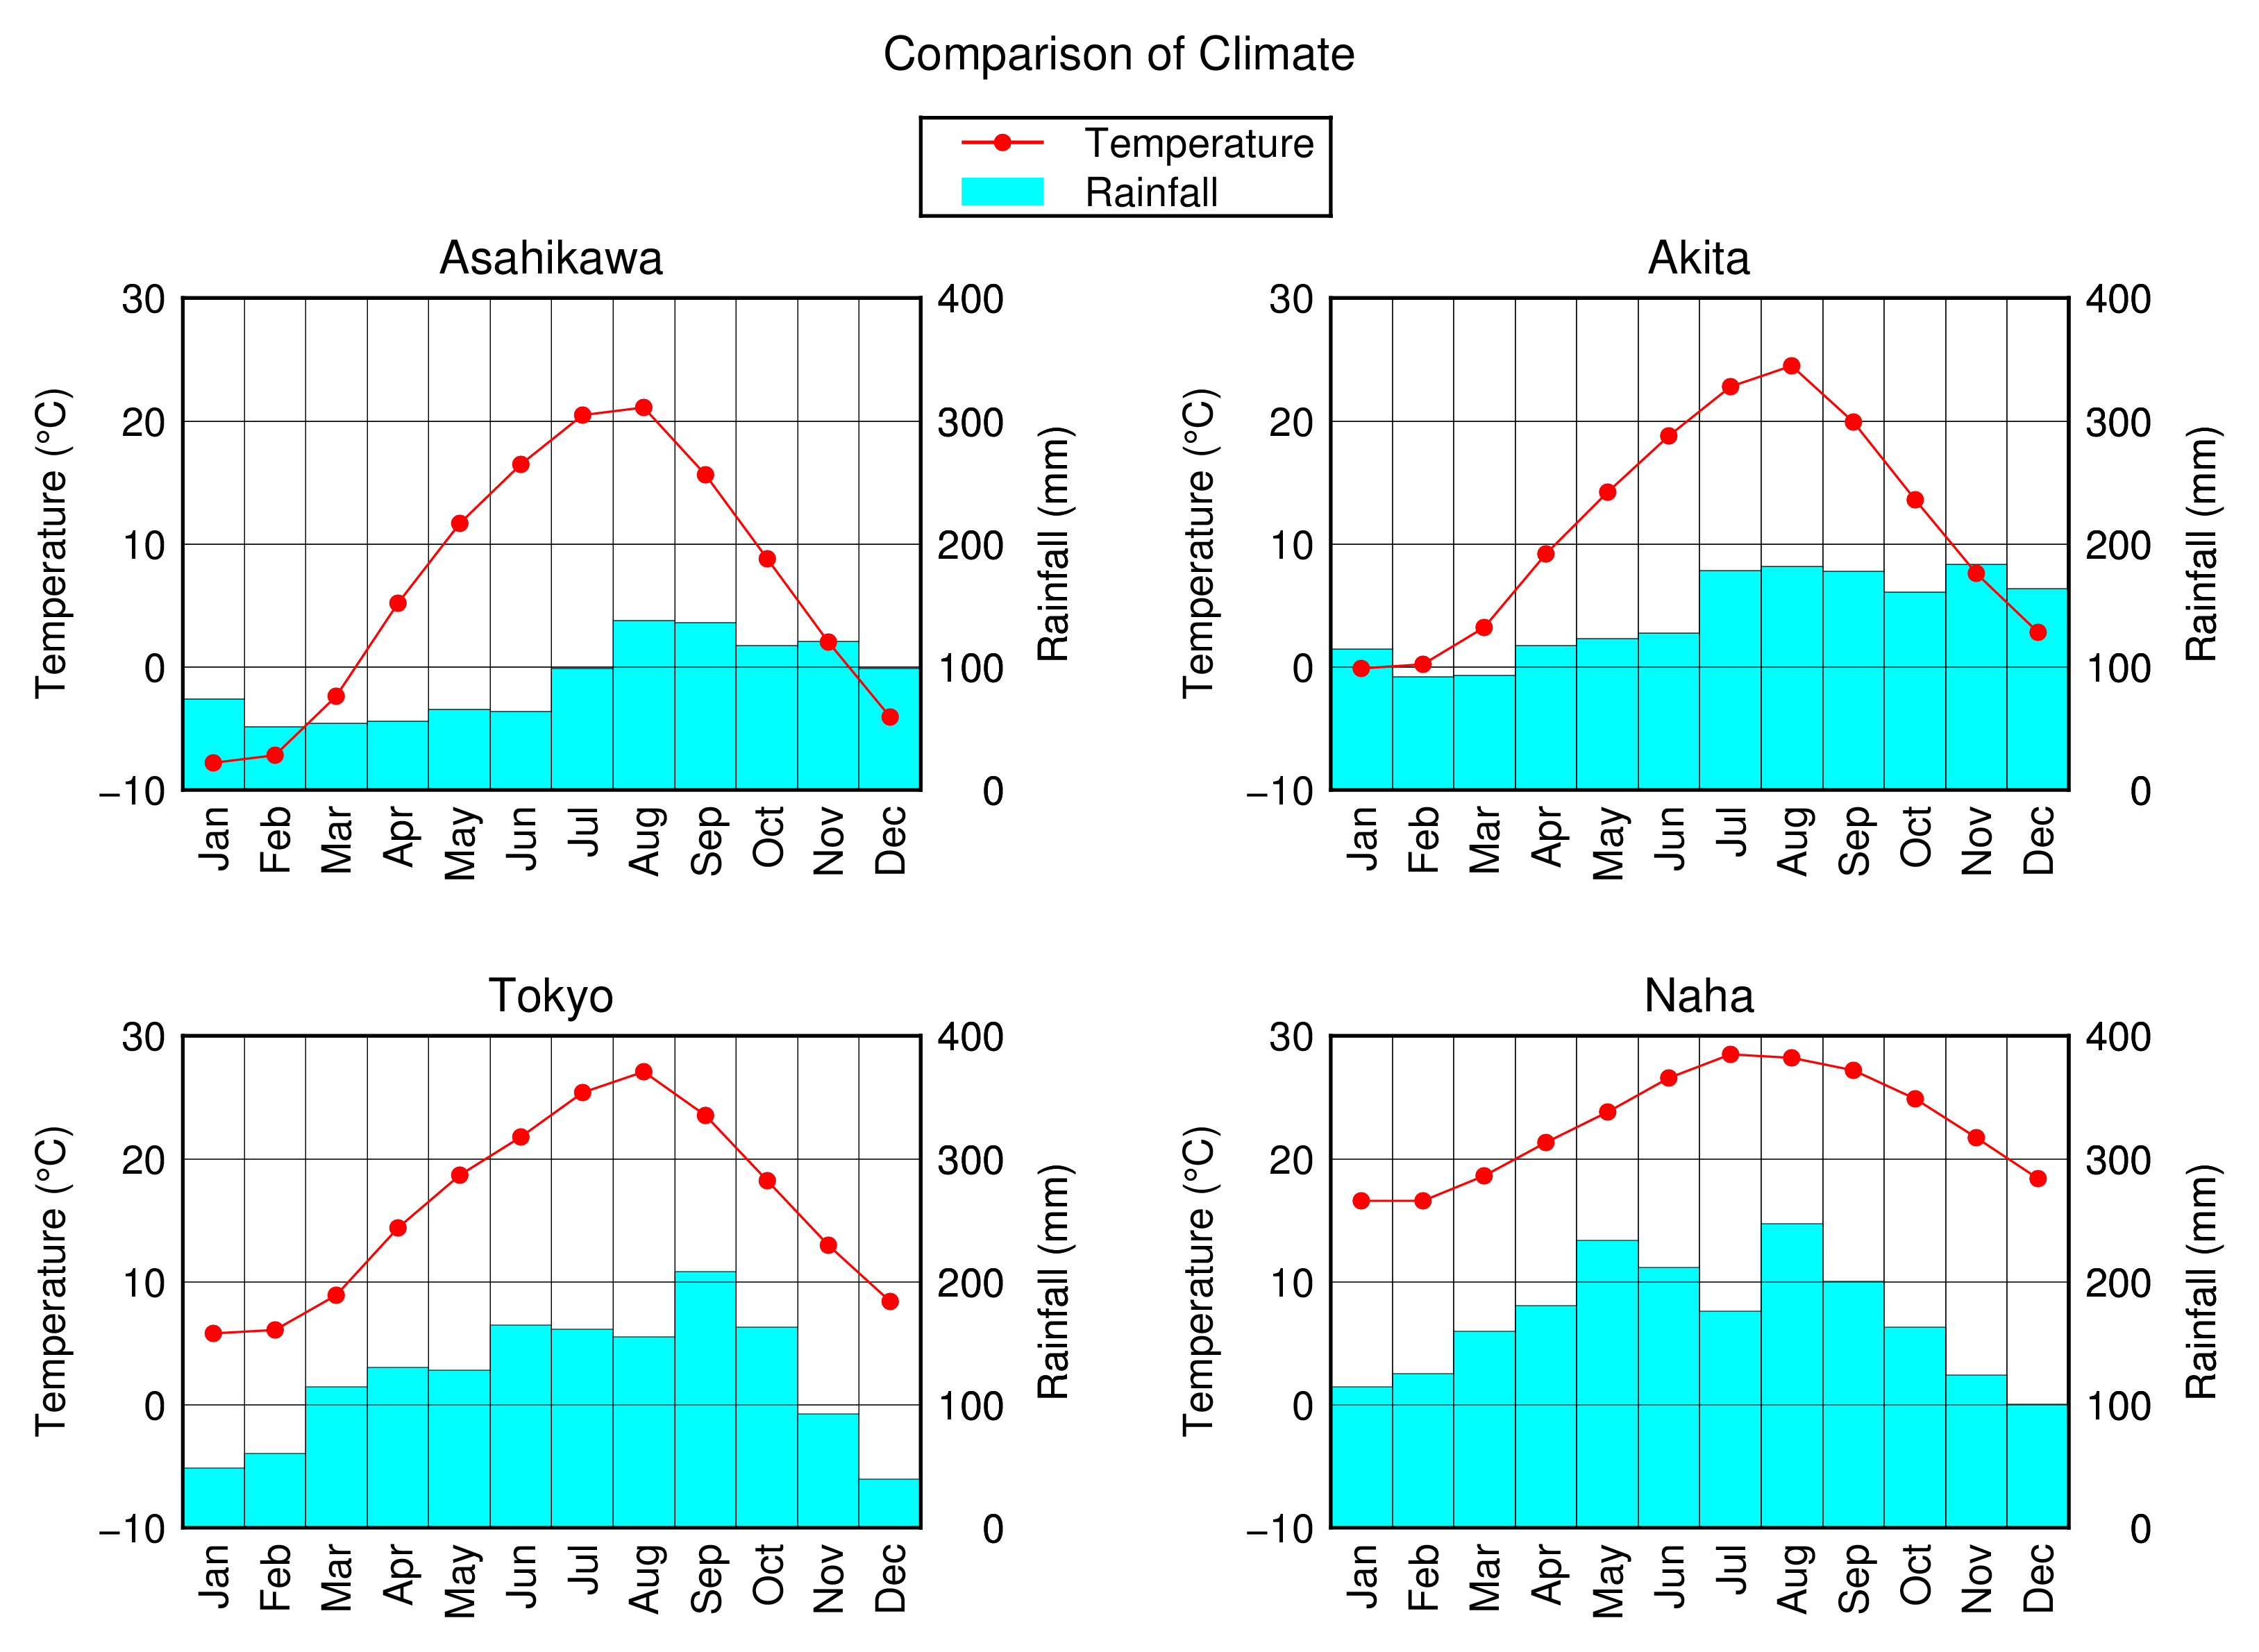
| bat_climate_ctl.txt | Batch file for control of GMT drawing |
| bat_climate_imp.txt | Batch file for main part of GMT drawing |
| inp_ASAHIKAWA.txt | Input file for Asahikawa |
| inp_AKITA.txt | Input file for Akita |
| inp_TOKYO.txt | Input file for Tokyo |
| inp_NAHA.txt | Input file for naha |
| fig_gmt_climate.png | Output image |
| Filename | Description |
|---|---|
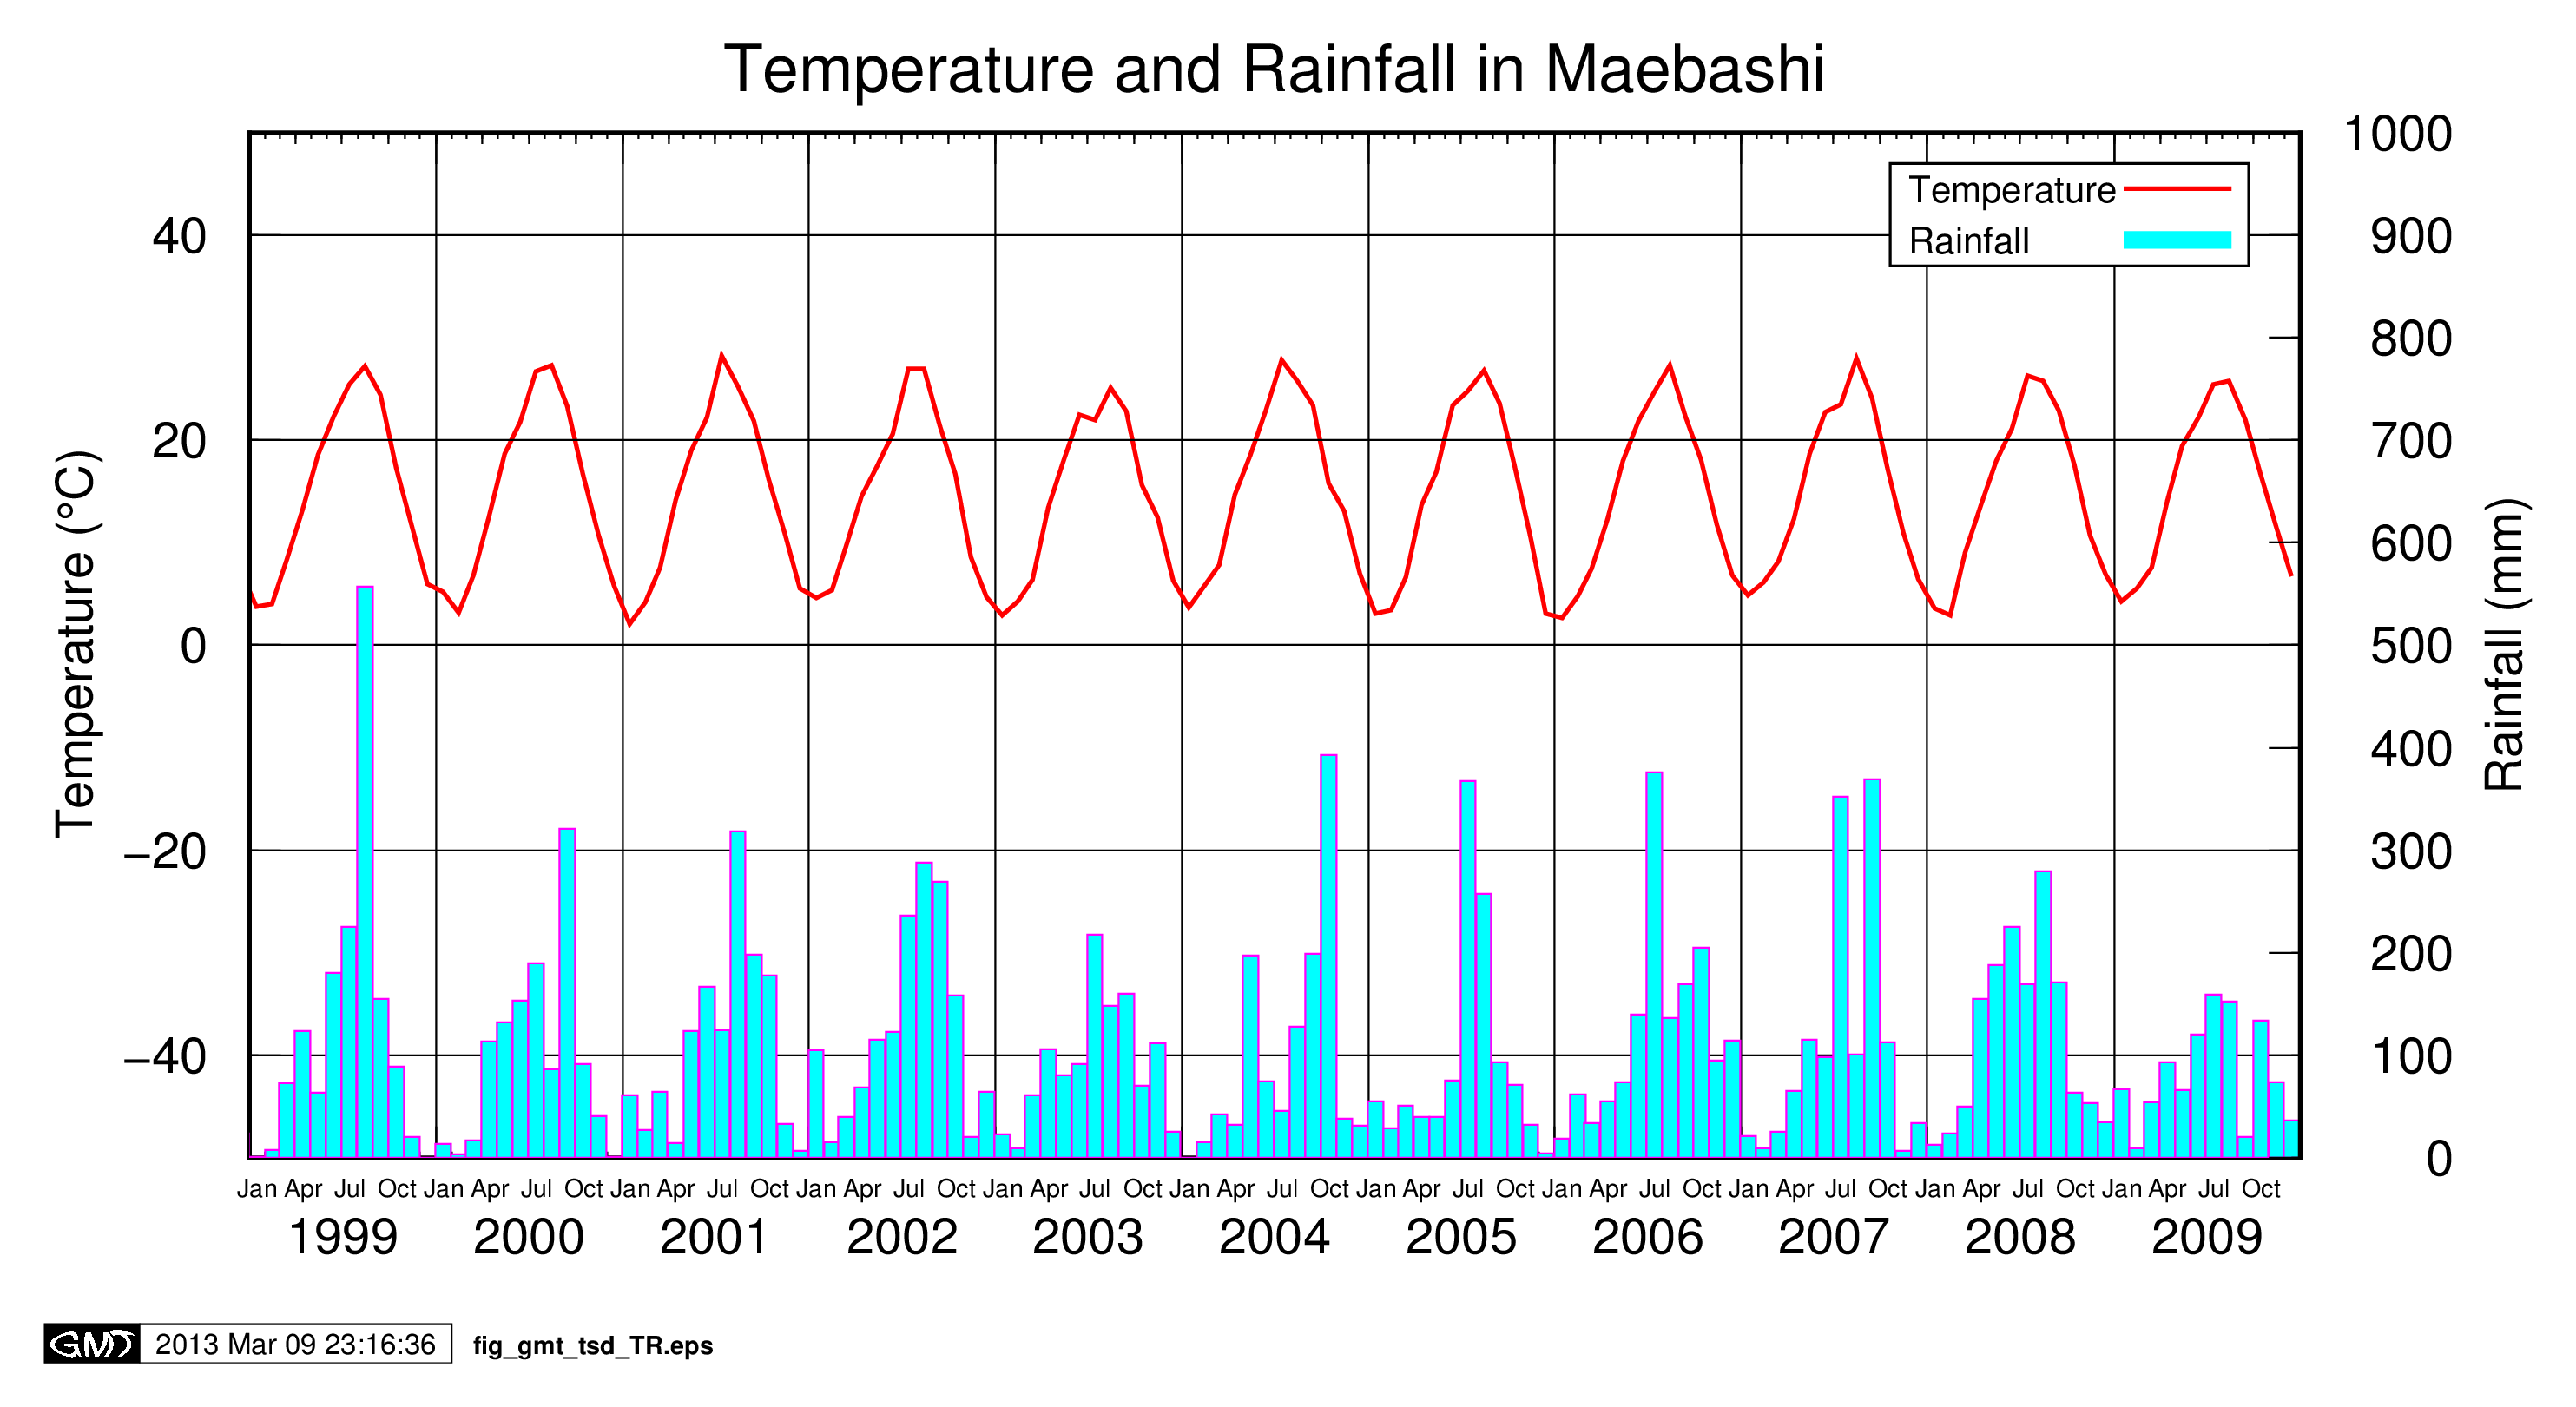
| awk_klegend.txt | Awk script for legend drawing by GMT |
| bat_tsd_TR.txt | Batch file for GMT execution |
| inp_TR_maebashi.txt | Input data for plotting |
| fig_gmt_tsd_TR.png | Output image |
(Note) Input data for legend drawing is created in the batch file for GMT execution.
| Filename | Description |
|---|---|
| awk_klegend.txt | Awk script for legend drawing by GMT |
| awk_sort.txt | Awk script for sorting |
| bat_tsd_Q.txt | batch file for GMT execution |
| inp_QKF2008.txt | Input data for plotting |
| inp_sort.txt | Input data after sorting by 'awk_sort.awk' (for duration curve) |
| fig_gmt_tsd_Q.png | Output image |
(Note) Input data for legend drawing is created in the batch file for GMT execution.
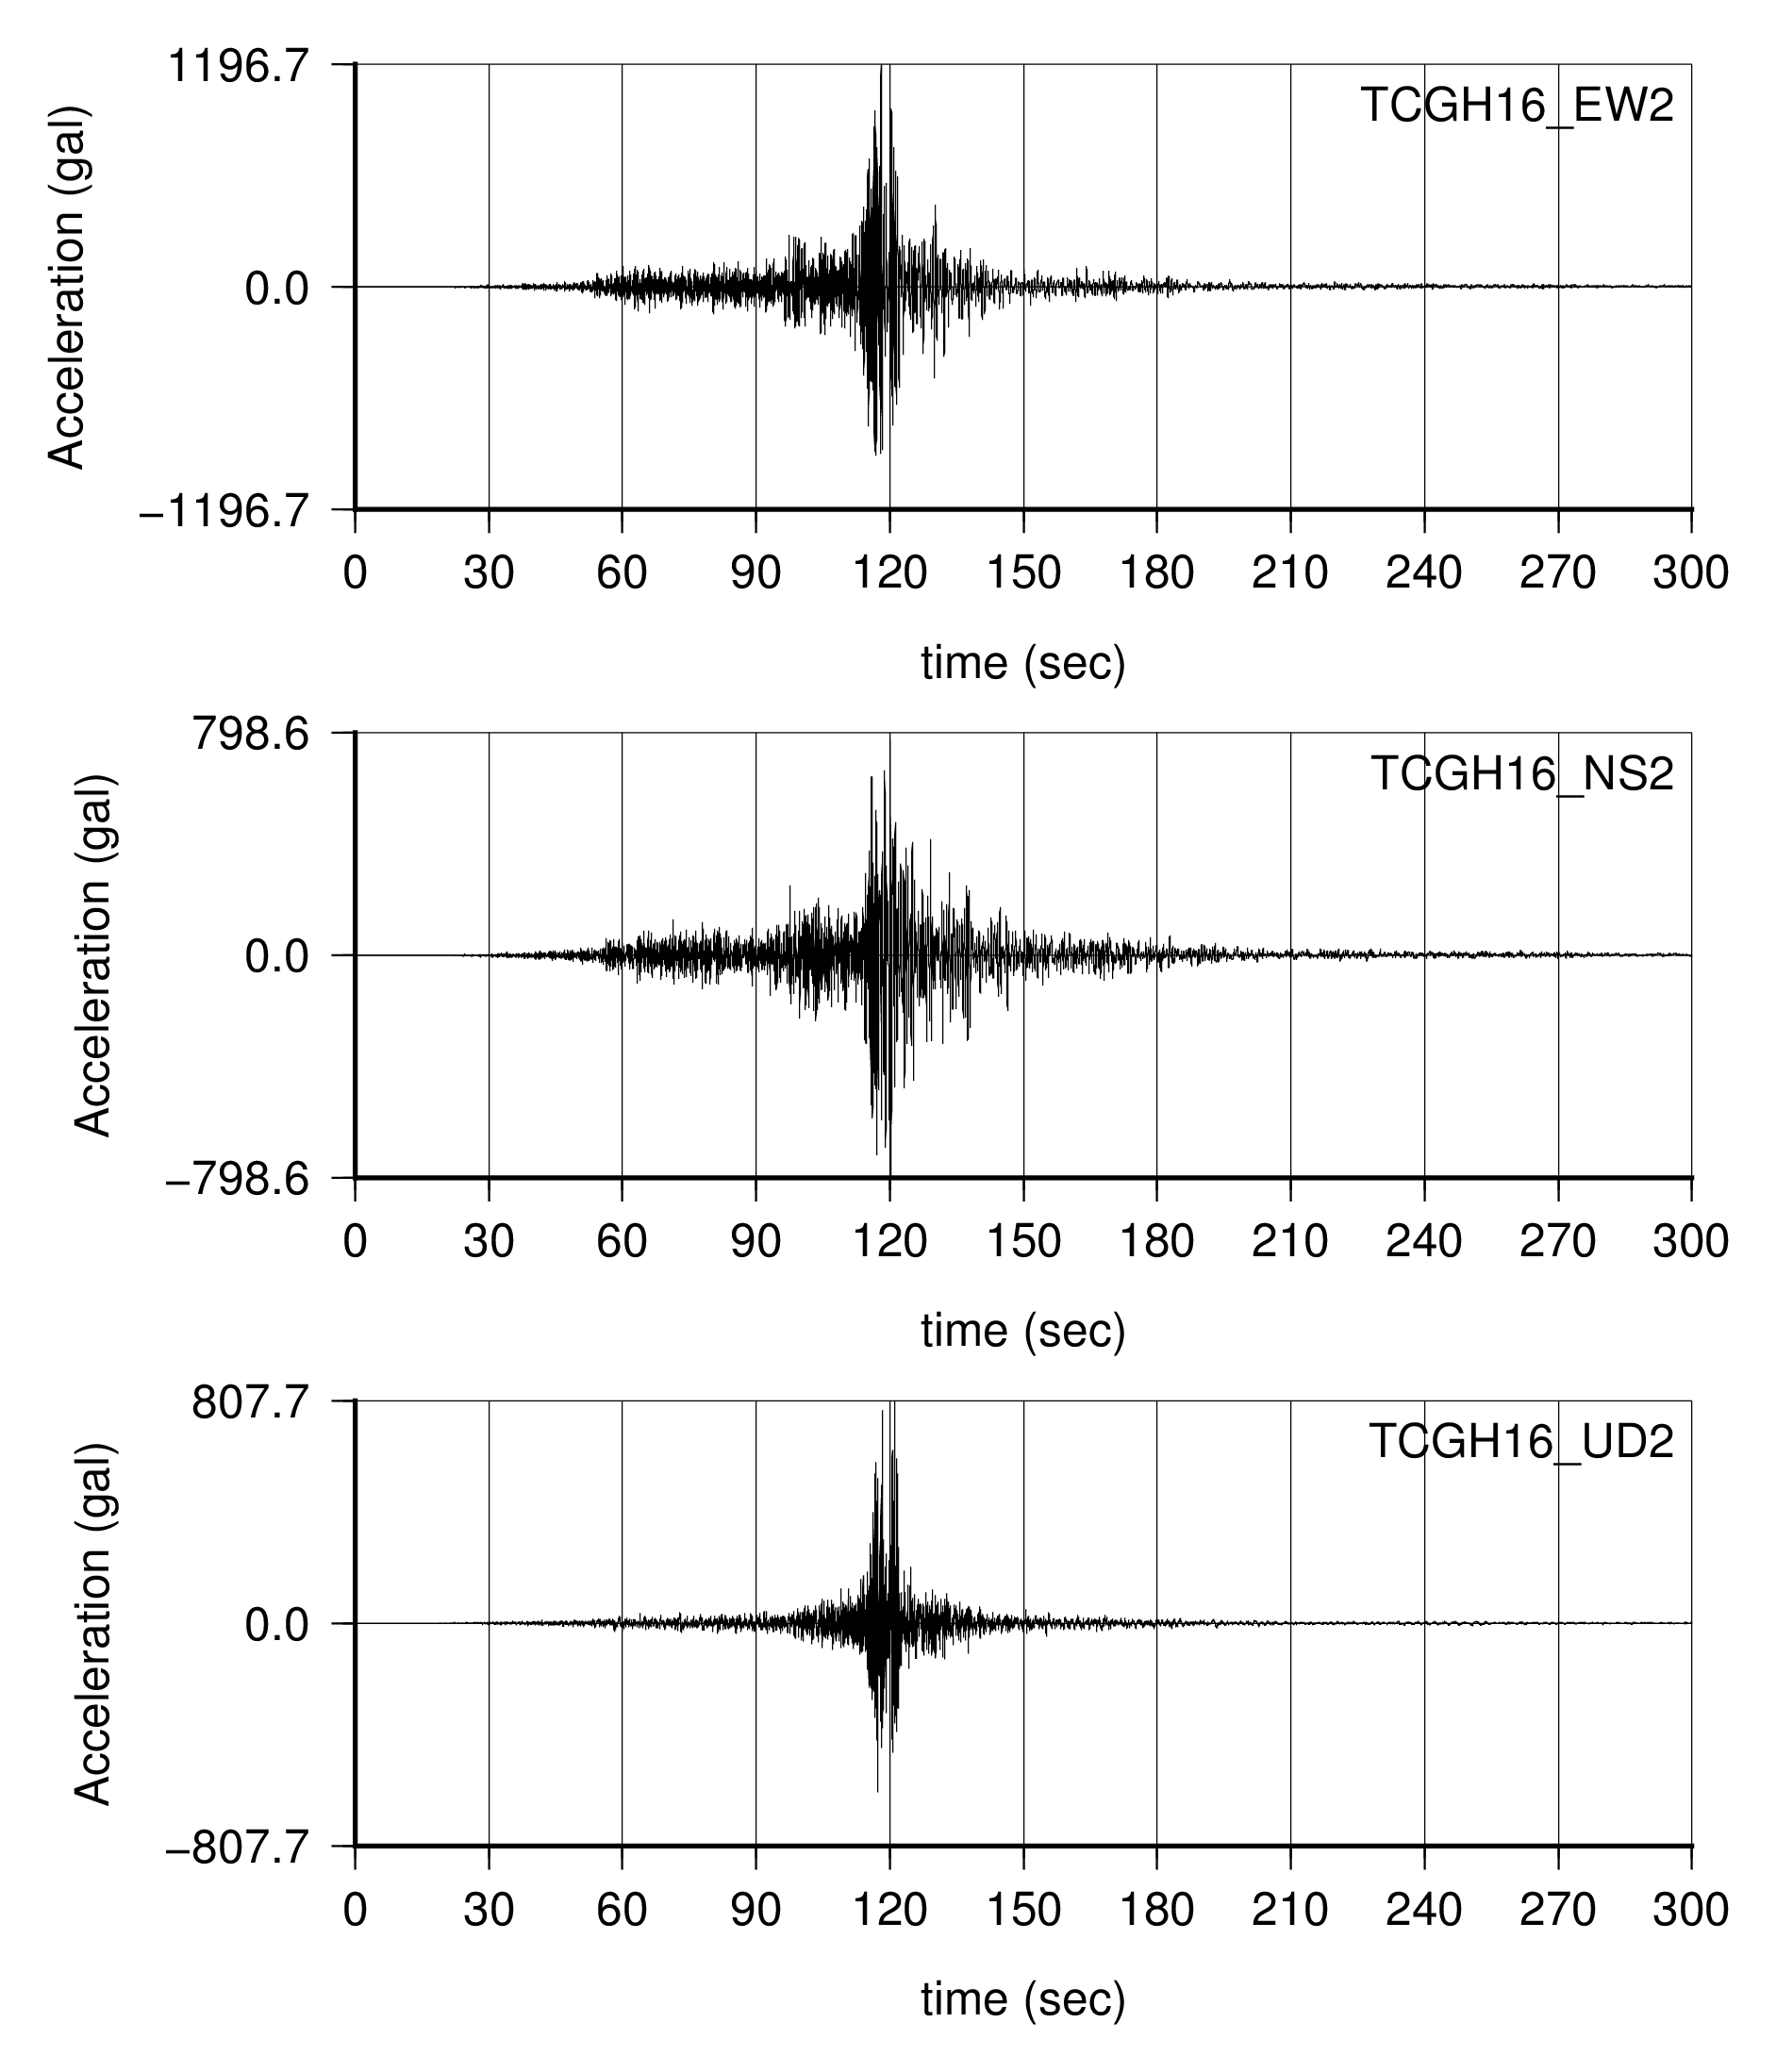
| dat_acc_TCGH16_EW2.csv |
2011/03/11 14:46:00 TCGH16 EW2 Max.acc=1196.697 | Comment dt,0.010 | Sampling period (sec) ndata,30000 | Number of data -1.890 | Acceleration (gal) -1.888 | ... -1.888 | ... -1.891 | ..... | ..... | |
| Filename | Description |
|---|---|
| awk_rga.txt | Awk script for searceing max.and min.values and making batch file for GMT. |
| bat_acc.txt | Batch file for GMT execution |
| fig_acc_TCGH16_2.png | Output image |
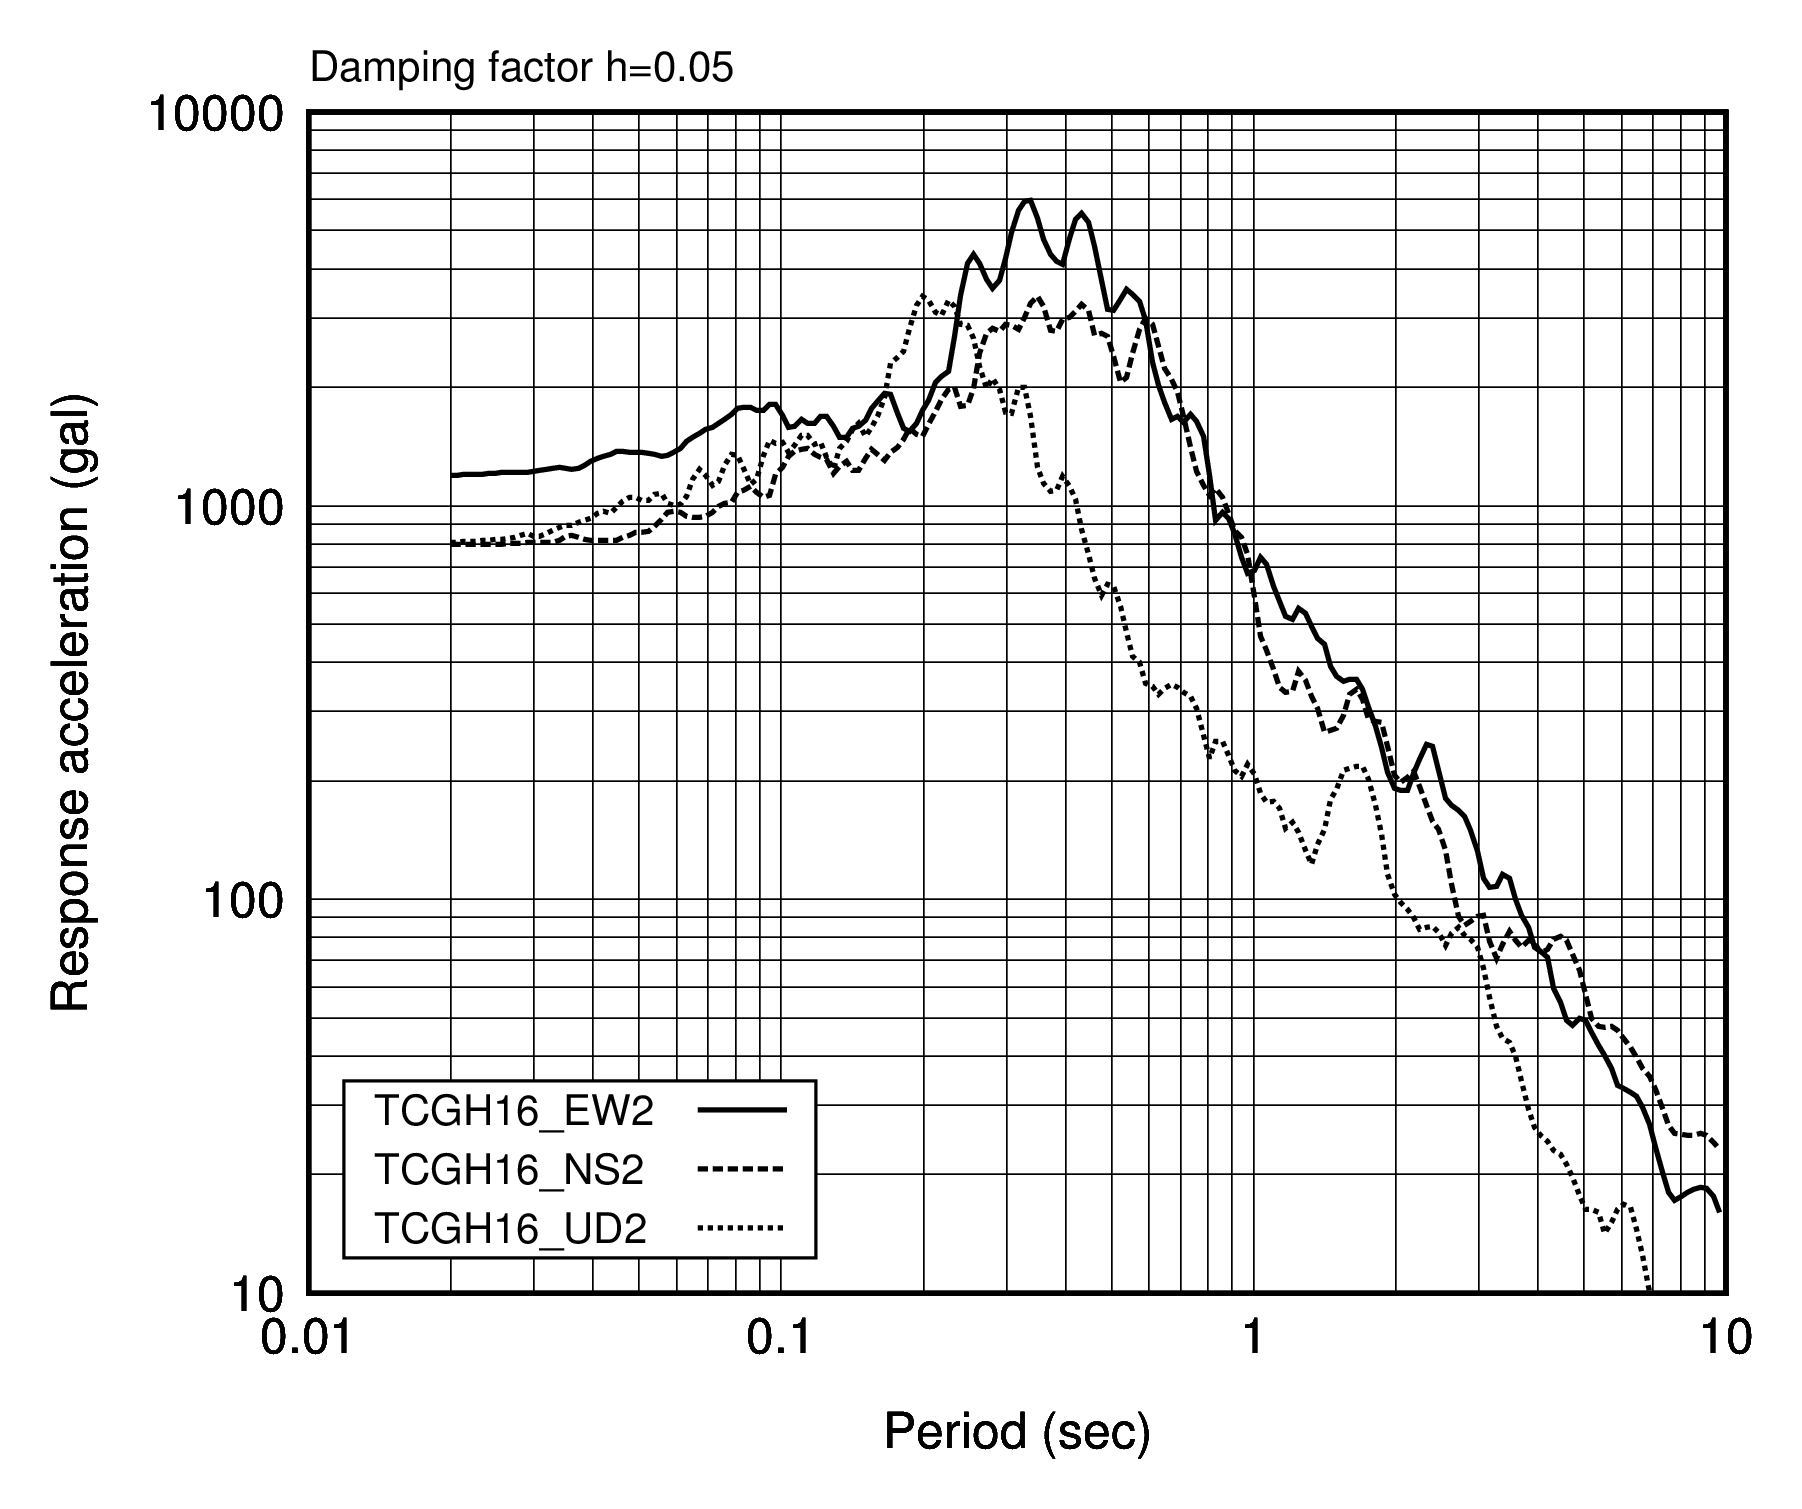
| dat_spc_TCGH16_EW2.csv |
2011/03/11 14:46:00 TCGH16 EW2 Max.acc=1196.697 | Comment nt,200 | Number of data period(sec) , acc(gal) , vel(kine) , dis(cm) | 2.000000e-002, 1.196764e+003, 2.924900e-001, 1.213241e-002 | Period and 2.063122e-002, 1.198466e+003, 3.113090e-001, 1.292889e-002 | Response 2.128236e-002, 1.200244e+003, 3.314467e-001, 1.377853e-002 | ..... ..... | ..... | |
| Filename | Description |
|---|---|
| awk_klegend.txt | Awk script for legend drawing by GMT |
| bat_spc.txt | Batch file for GMT execution |
| fig_spc_t.png | Output image |
(Note) Input data for legend drawing is created in the batch file for GMT execution.
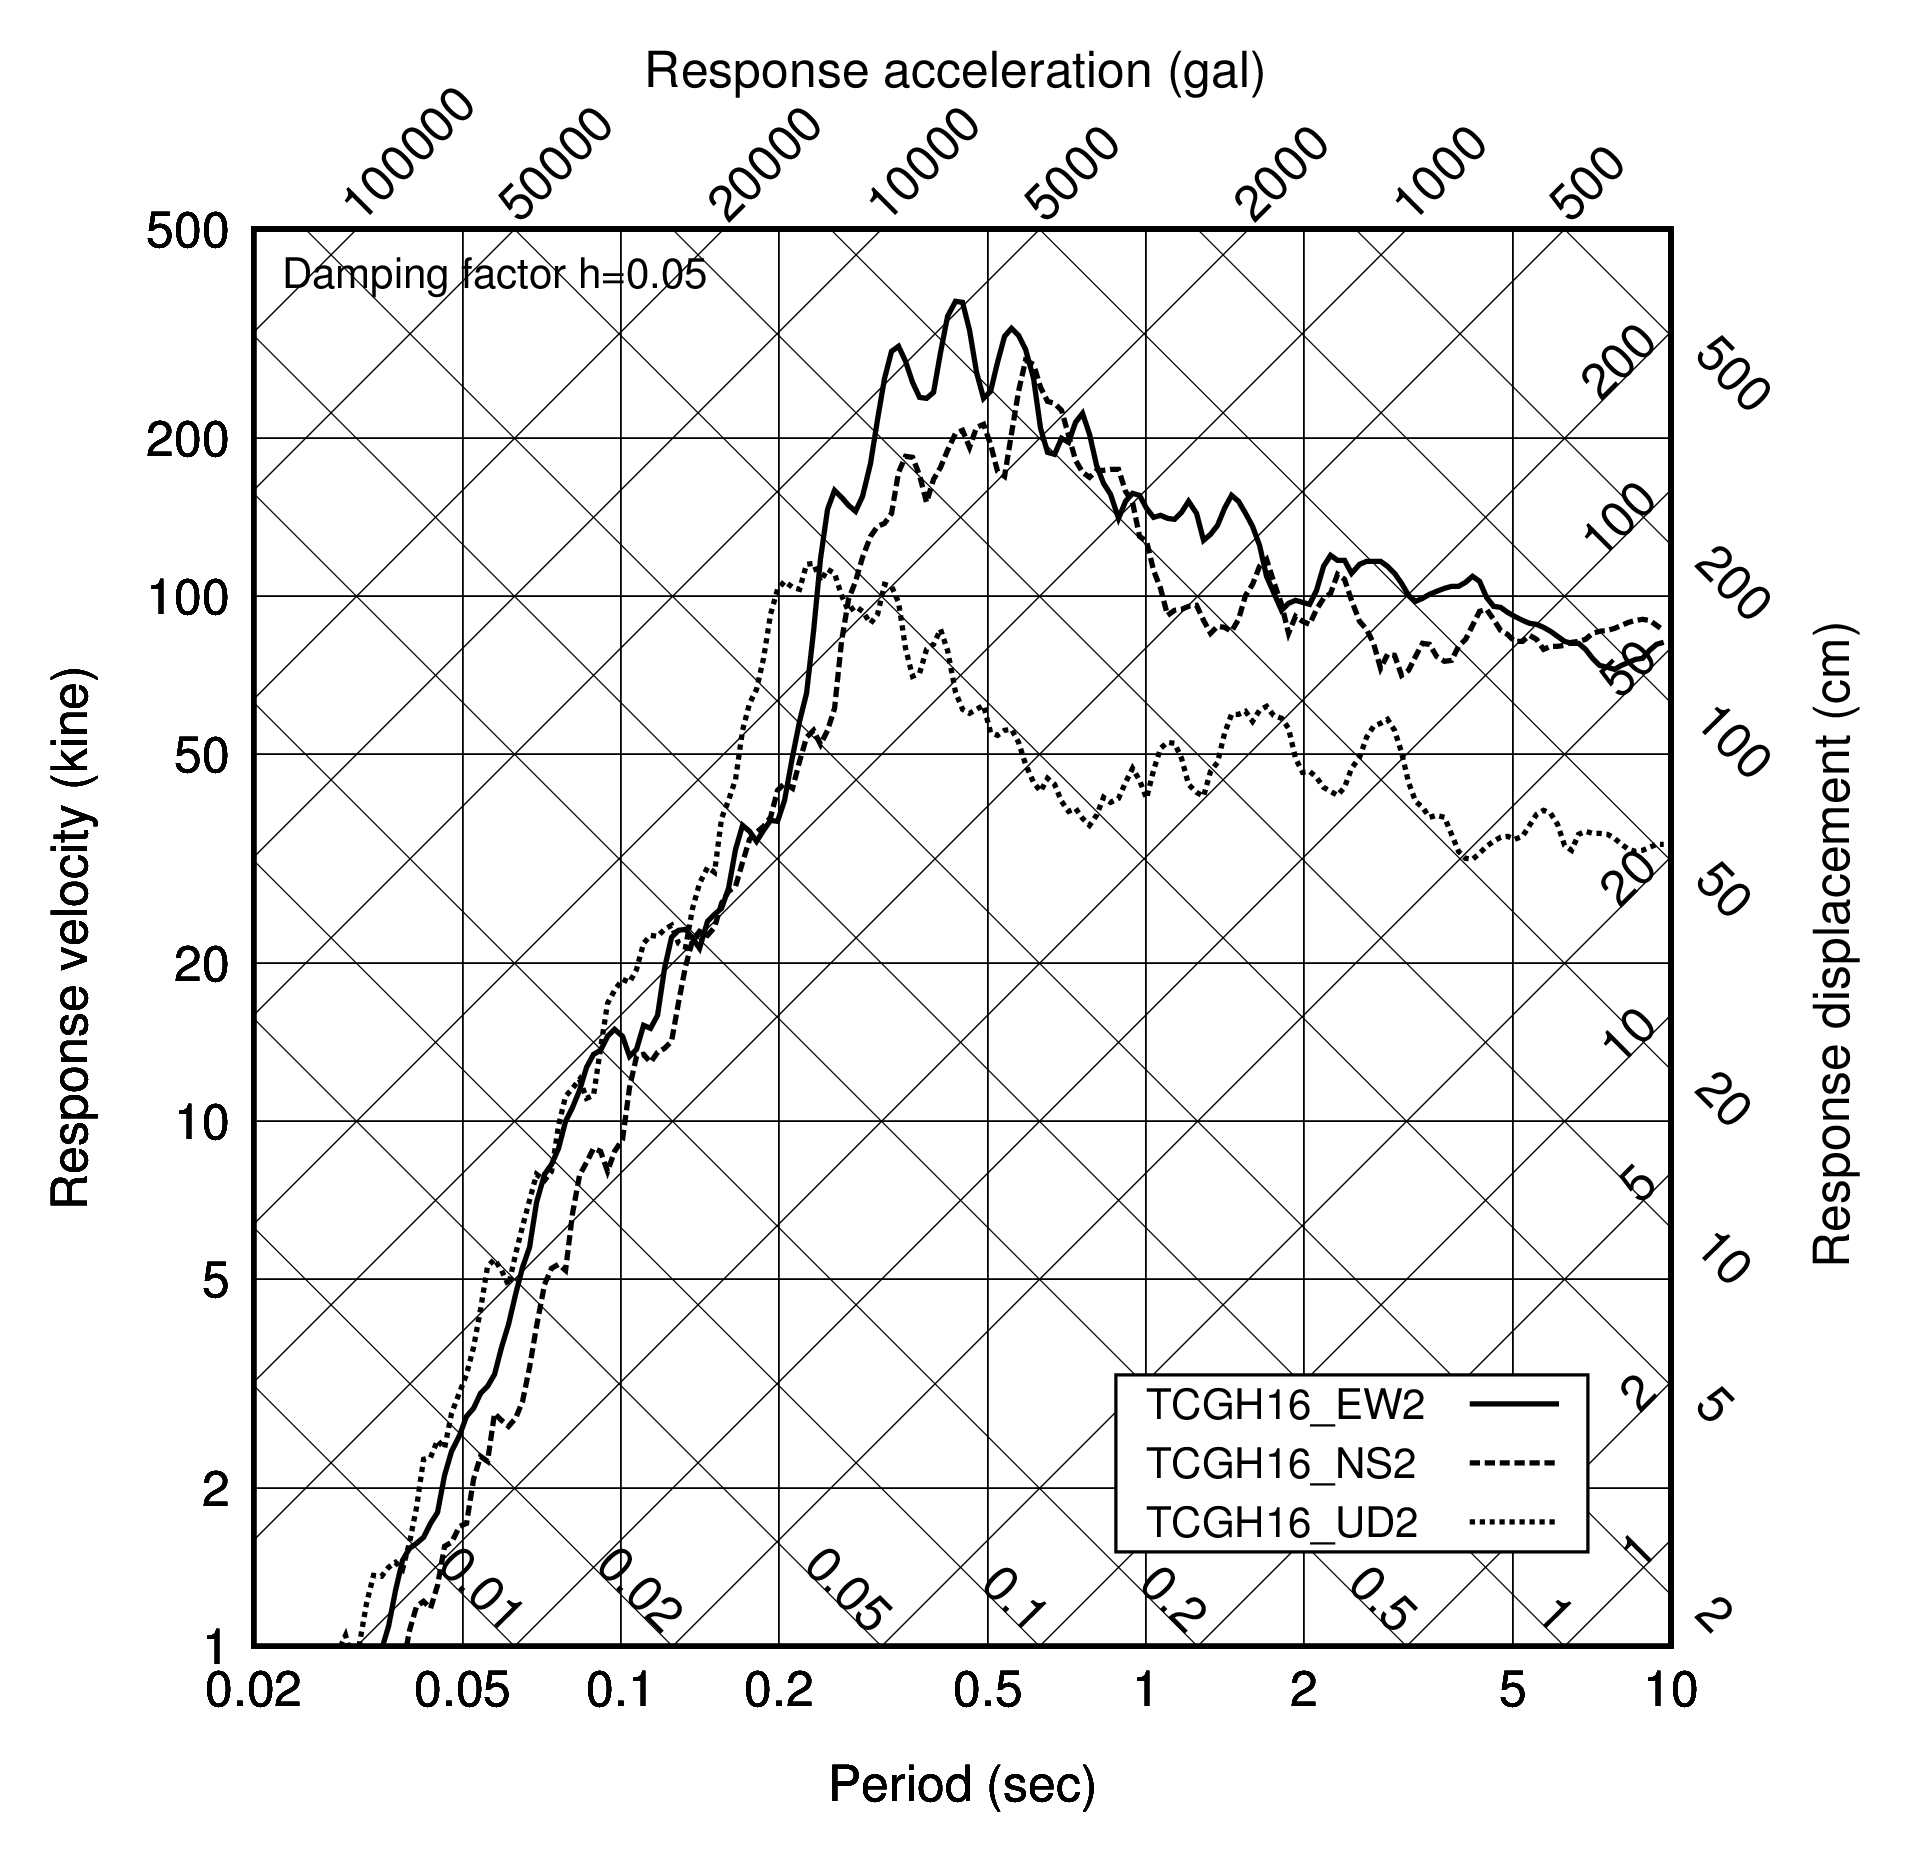
| dat_spc_TCGH16_EW2.csv |
2011/03/11 14:46:00 TCGH16 EW2 Max.acc=1196.697 | Comment nt,200 | Number of data period(sec) , acc(gal) , vel(kine) , dis(cm) | 2.000000e-002, 1.196764e+003, 2.924900e-001, 1.213241e-002 | Period and 2.063122e-002, 1.198466e+003, 3.113090e-001, 1.292889e-002 | Response 2.128236e-002, 1.200244e+003, 3.314467e-001, 1.377853e-002 | ..... ..... | ..... | |
| Filename | Description |
|---|---|
| awk_klegend.txt | Awk script for legend drawing by GMT |
| awk_axis_line.txt | Awk script for making line data for GMT |
| awk_axis_label.txt | Awk script for making label data for GMT |
| bat_trs.txt | Batch file for GMT execution |
| fig_trs_t.png | Output image |
(Note) Input data for legend drawing is created in the batch file for GMT execution.
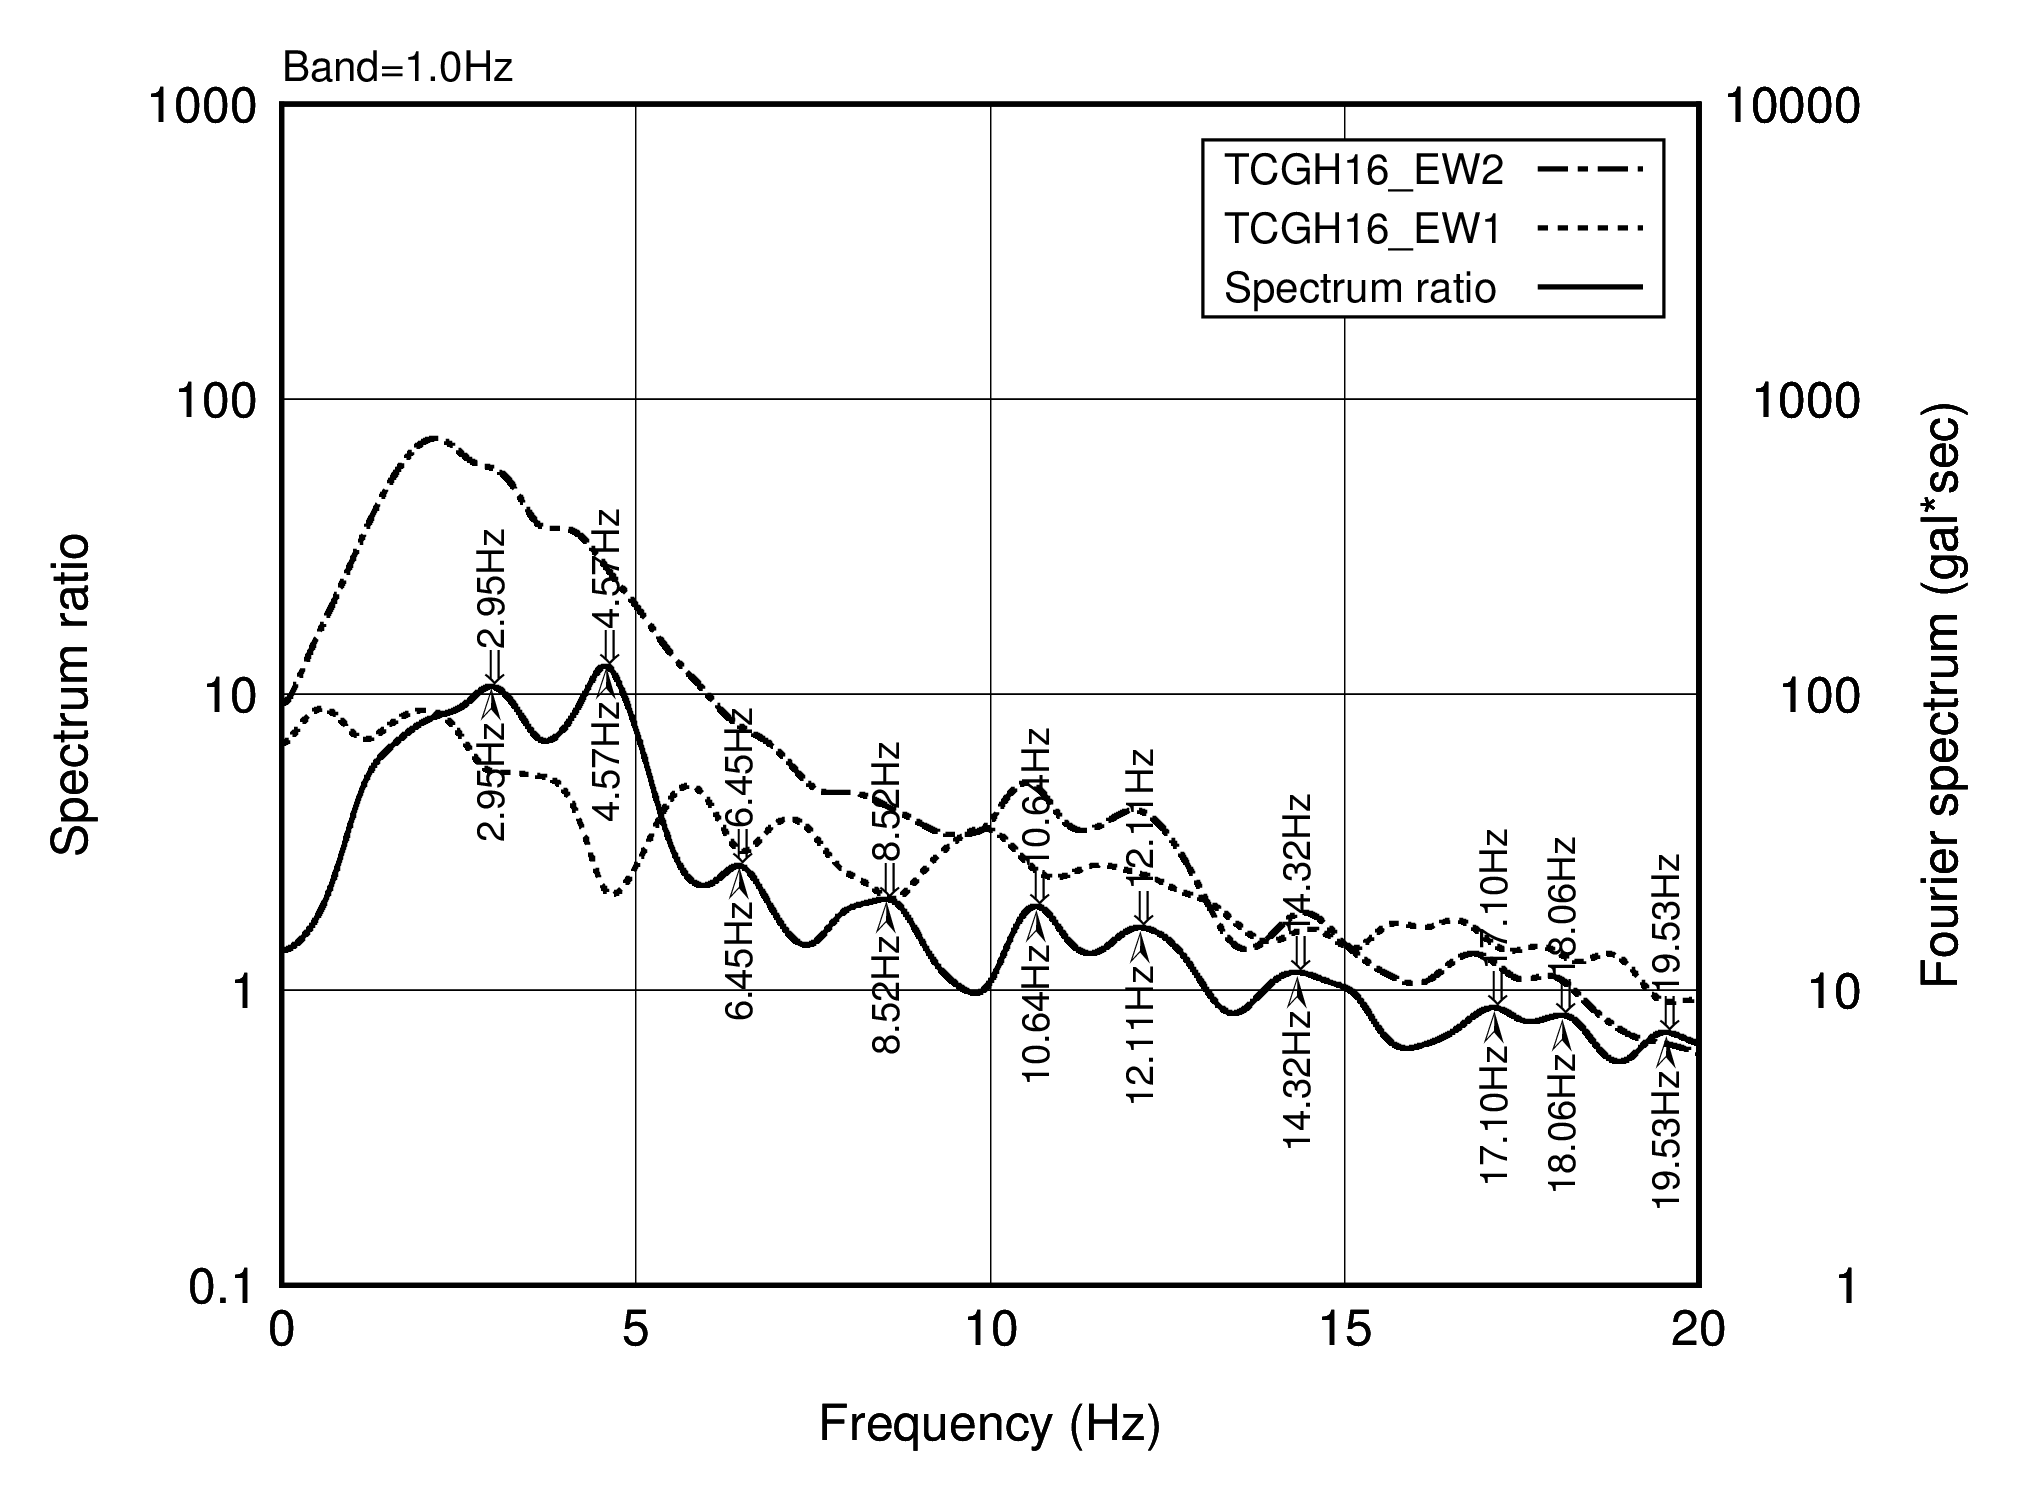
| inp_fsr_t.csv |
i, frq(Hz) , sp1 , sp2 , spr 1, 0.0000000000000000 , 68.644469660094956, 93.489593441899203, 1.3619391905106006 2, 3.05175781250000000E-003, 68.646266058682215, 93.493209037733777, 1.3619562199903368 3, 6.10351562500000000E-003, 68.651654422441766, 93.504054788801866, 1.3620073044916456 ..... ..... |
| i | No. |
| frq | Frequency (Hz) |
| sp1 | Fourier spectrum 1 |
| sp2 | Fourier spectrum 2 |
| spr | Spectrum ratio (sp2 / sp1) |
| Filename | Description |
|---|---|
| awk_klegend.txt | Awk script for legend drawing by GMT |
| awk_ssmv0.txt | Awk script for peak searching (font 12, symbol 334) |
| awk_ssmv1.txt | Awk script for peak searching (font 34, symbol 342) |
| bat_fsr.txt | Batch file for GMT execution |
| fig_fsr_EW1.png | Output image 1 |
| fig_fsr_EW2.png | Output image 2 (E-axis range and expression of scale are changed) |
(Note) Input data for legend drawing is created in the batch file for GMT execution.
| Filename | Description |
|---|---|
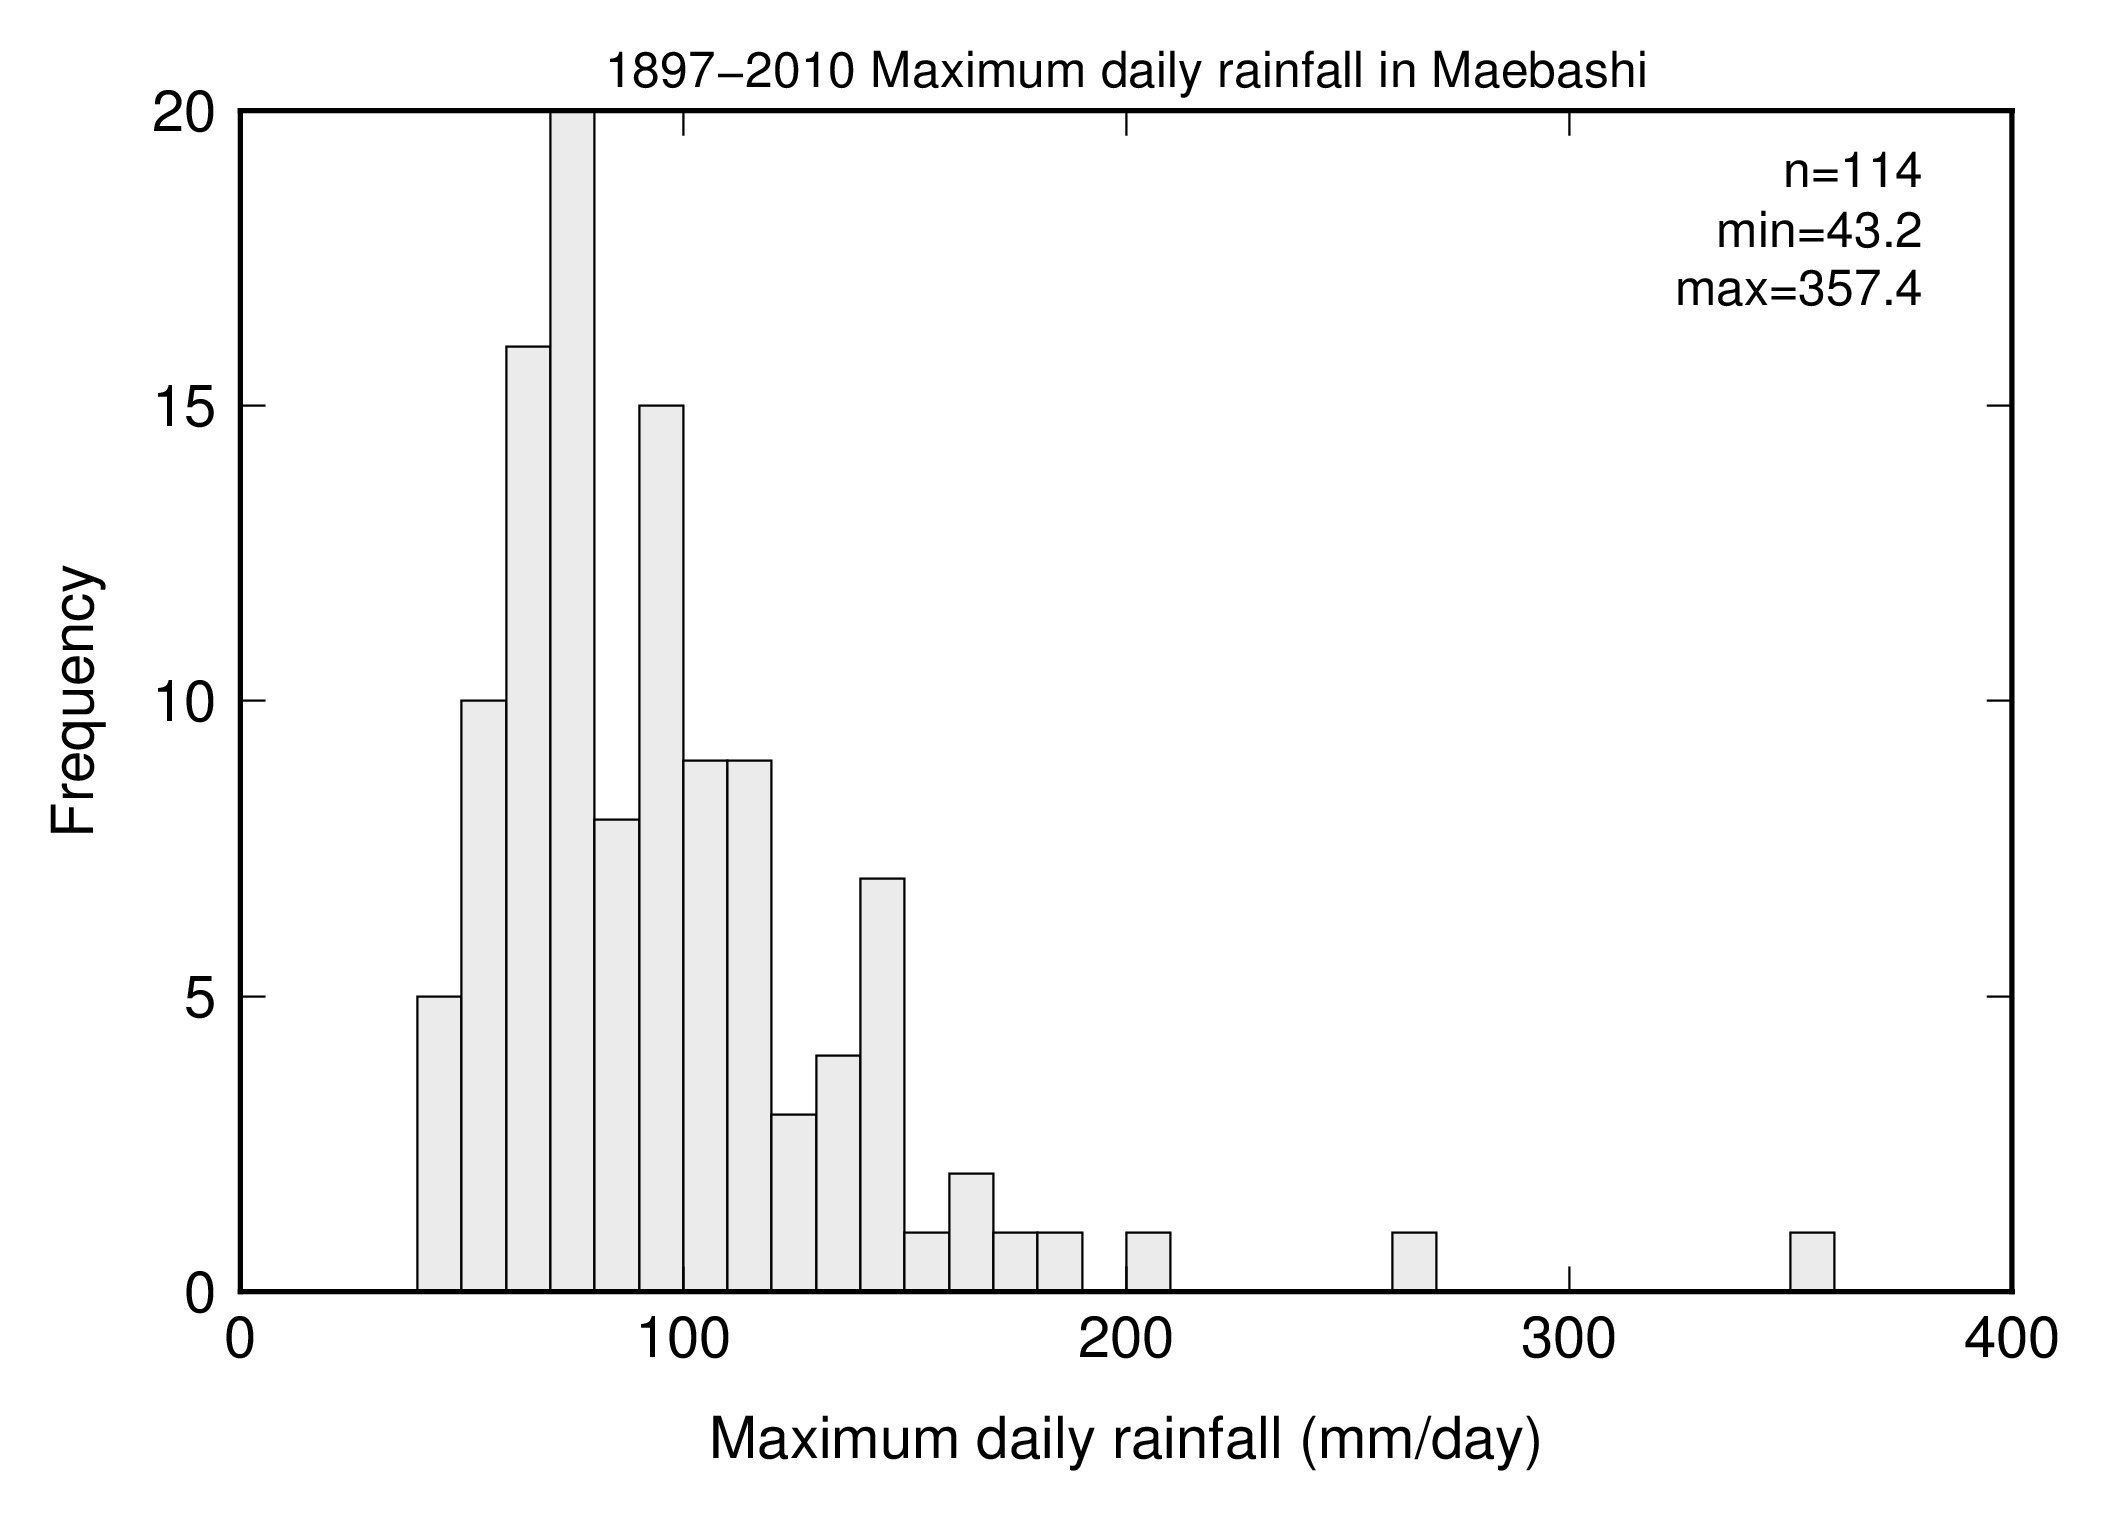
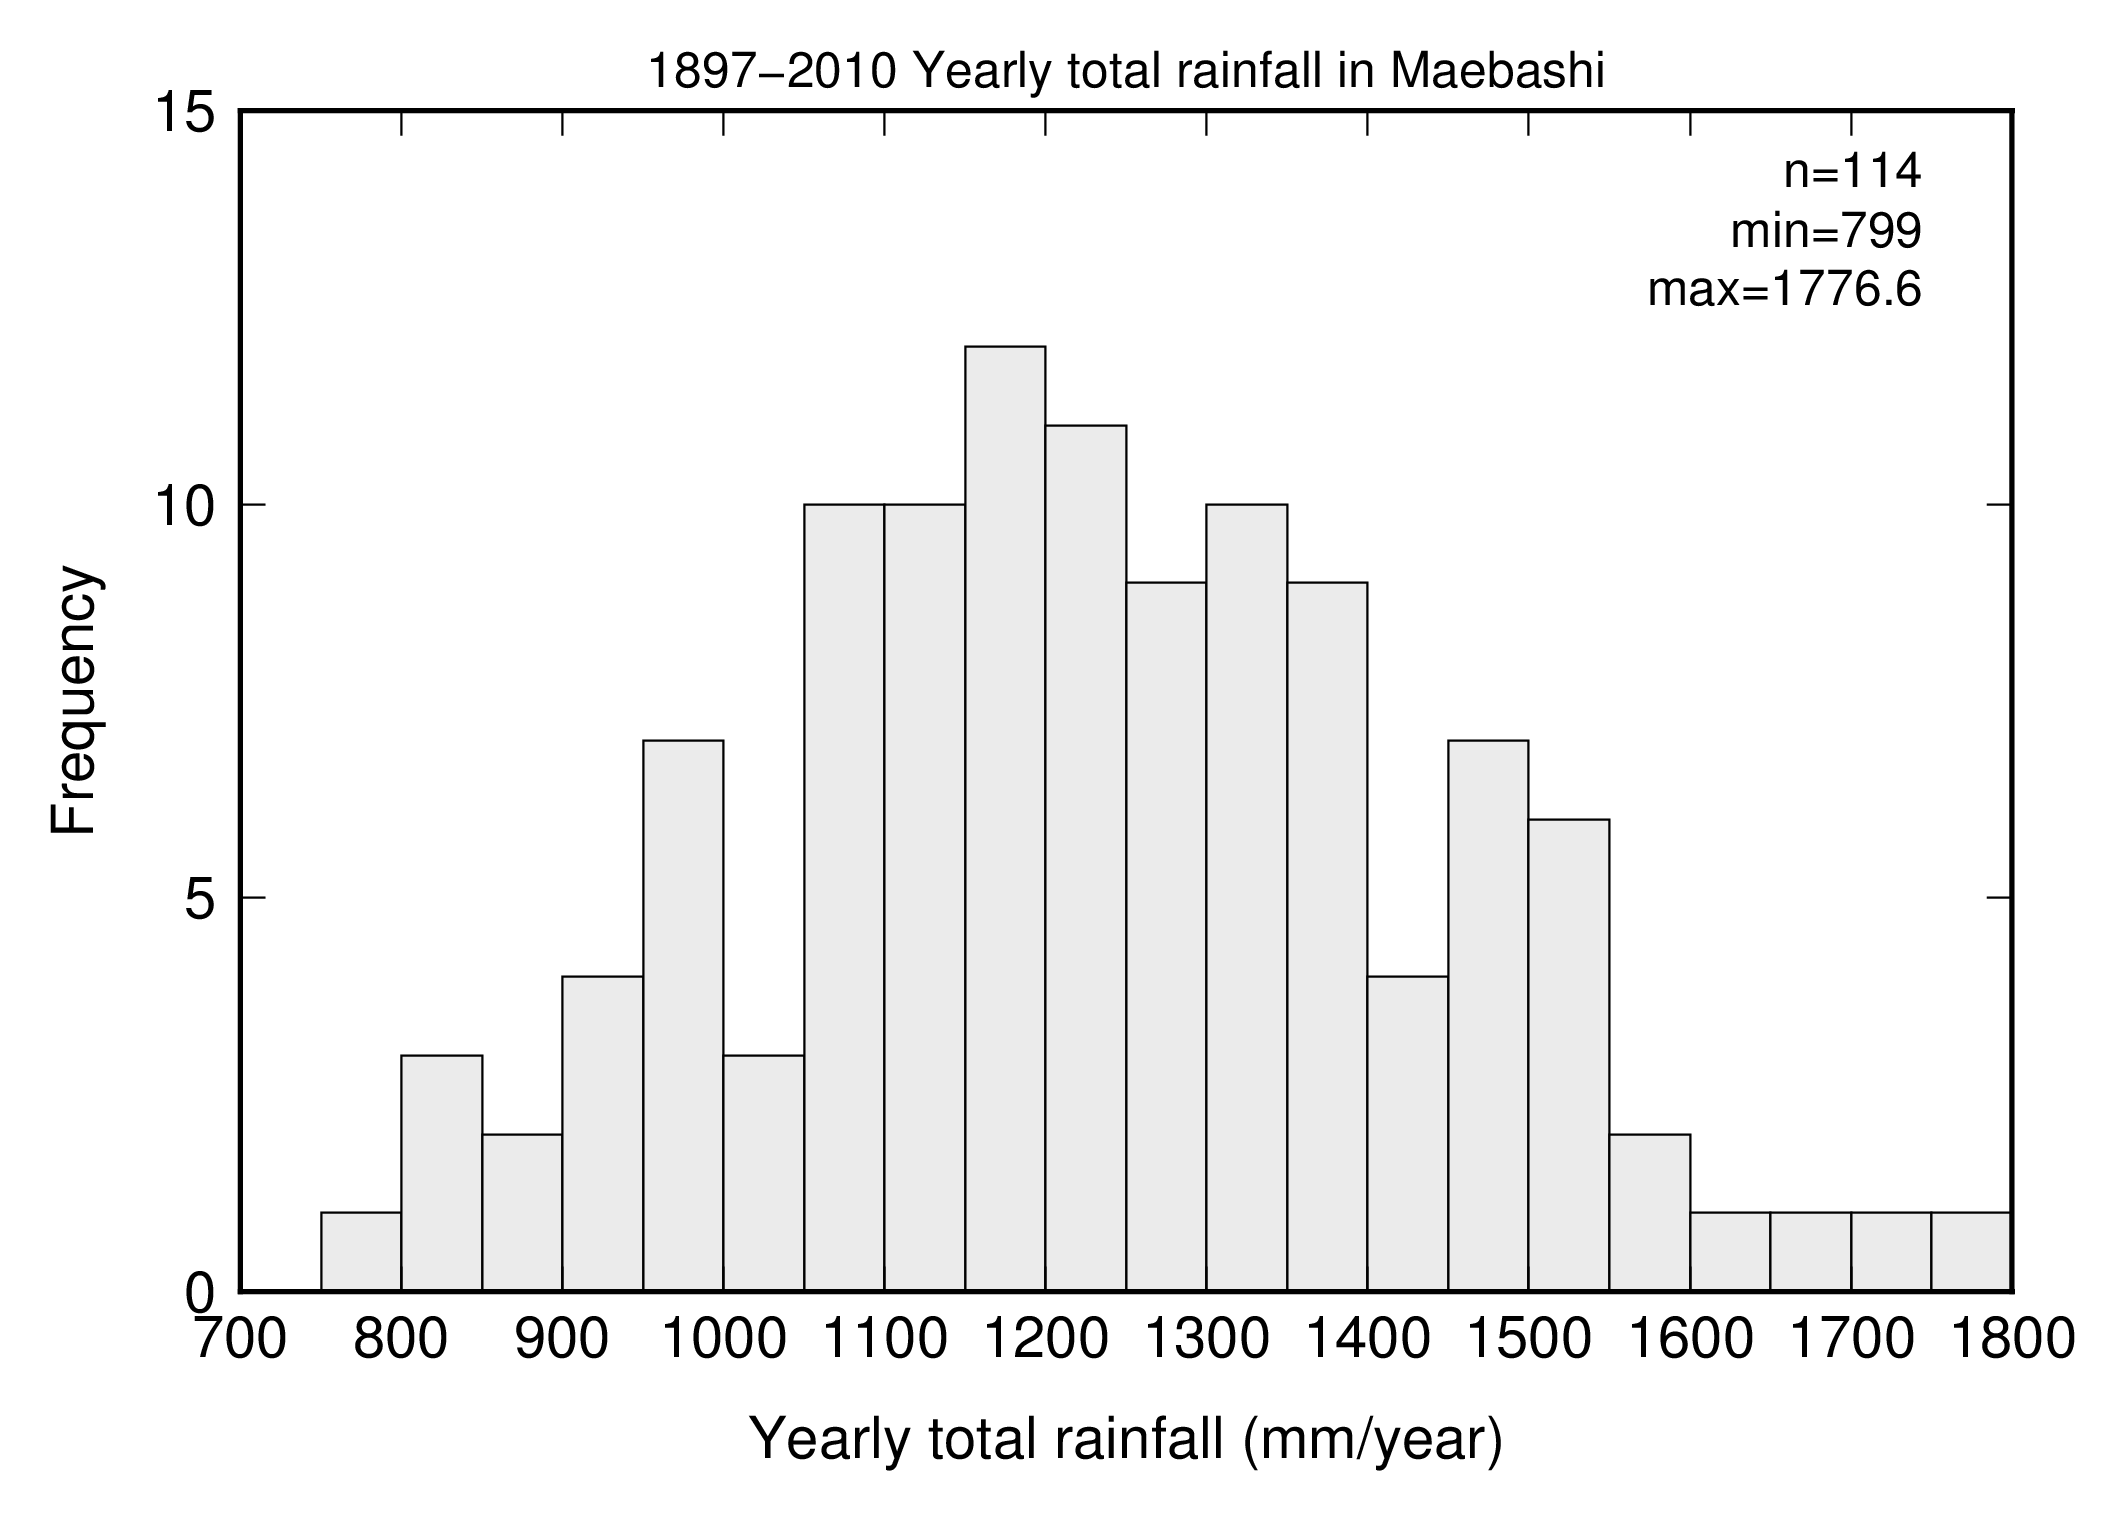
| bat_HISTO.txt | Batch file for GMT execution |
| inp_PRB_DM.txt | Input data (max. daily rainfall) |
| inp_PRB_YT.txt | Input data (cumulative rainfall) |
| out_DM_HISTO.txt | Output by minmax, pshistogram (max.daily rainfall). First row shows the output by minmax. |
| out_YT_HISTO.txt | Output by minmax, pshistogram (cumulative rainfall). First row shows the outout by minmax. |
| fig_DM_HISTO.png | Output image (max.daily rainfall) |
| fig_YT_HISTO.png | Output image (cumulative rainfall) |