Outline of this page
In this page, methods to express the FEM results using GMT are introduced.
Drawings in eps format by GMT are converted to drawings in png format using 'ImageMagick.'
Drawing FEM mesh and contour map by GMT
- Fortran program carries out followings.
- To read output file by FEM program
- To carry out data processing and output data file for drawing by GMT
- To output a batch file for executing GMT (filename: bat_gmt_xxxx.bat)
- To execute the batch file and output eps files using built-in subroutine ''system('bat_gmt_xxxx.bat')'' of Fortran 90
Drawing 2D plot with legend by GMT
- Although it is easy to insert the legend in case of using gnuplot, it is not easy to insert it in case of using GMT.
So, webmaster made a program to make script which can execute 2D plot with legend in case of using GMT.
- This program is made with following way of thinking.
- To superimpose the legend on the original plots
- To define the size of legend area using number of characters and number of plot symbols
- To fill the legend area with white color and draw the symbols and characters.
- To be able to change the location of legend area like gnuplot
Expression of the result of heat conduction analysis
Outline
This is a Fortran program to show FEM mesh and 3D plot of temperature distribution by using GMT.
Fortran program (f90_GMTheat.f90)
Some explanations are shown below.
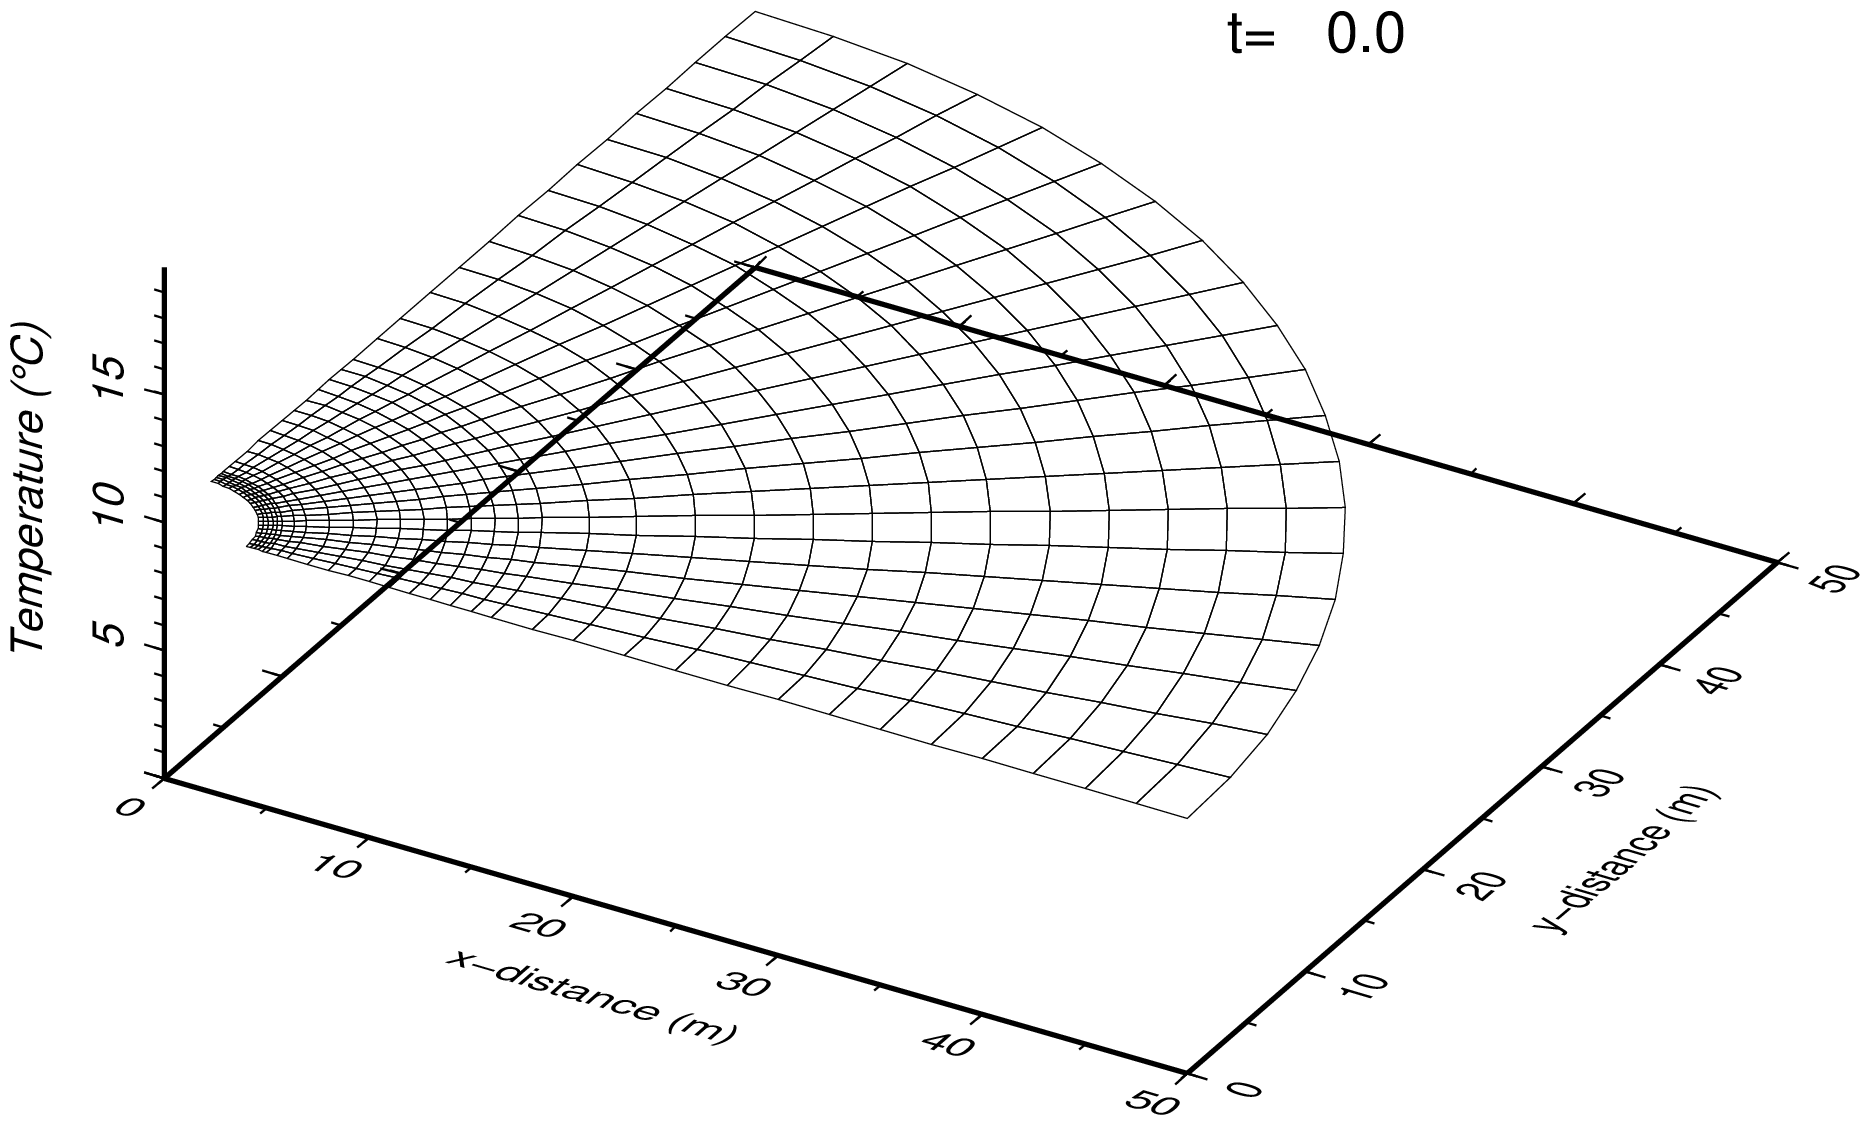
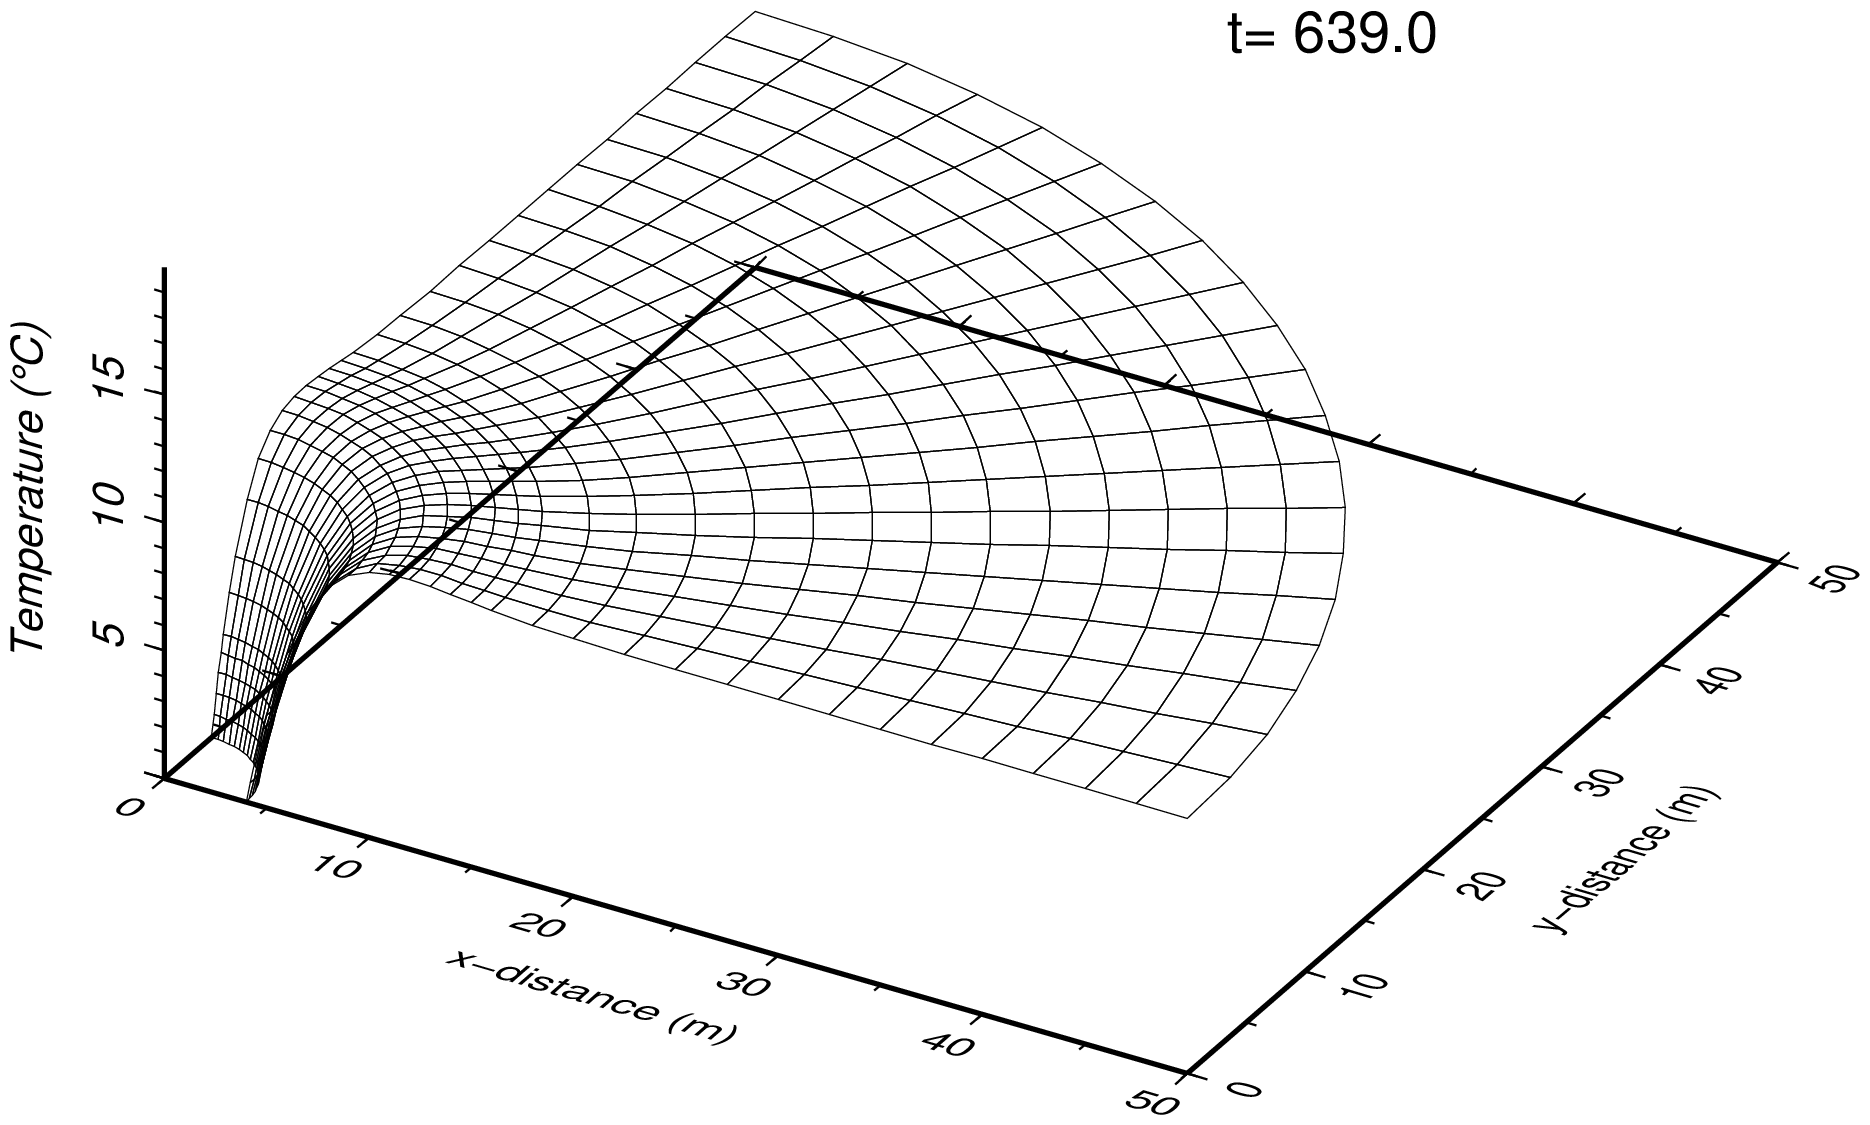
- This program shows 3D plot of temperature distribution by using the GMT command 'psxyz.'
- x-coordinate and y-coordinate are plane coordinate of elements, and z-coordinate is the temperature at defined time.
- Output filename is defined automatically in the program.
Following files must be prepared before execution of the program.
| Filename | Description | Remarks |
|---|
| _col_mesh.txt | Input file for defining mesh color. | Filename is fixed |
| _inp_base.txt | Input file for drawing information | Filename is fixed |
| out_CPT_ondom.csv | Output file by FEM analysis | Filename is changeable |
Output file by FEM analysis is a output by the program 'f90_FEM_HEAT.exe' made by webmaster.
Batch file which carries out the process is shown below.
Some files which are read from Fortran program are made in this batch file.
001  gfortran -o f90_GMTheat.exe f90_GMTheat.f90
002
003  rem definition of mesh color (1:MATEL)
004  echo 255,192,203 > _col_mesh.txt
005  echo 255,250,205 >> _col_mesh.txt
006
007  rem definition of basic data
008  rem integer::ind,ibc
009  rem real(4)::baselength,baseheight
010  rem real(4)::bavx,bfvx
011  rem real(4)::bavz,bfvz
012  rem character::strx*100,stry*100
013  echo 0 0 > _inp_base.txt
014  echo 10.0 5.0 >> _inp_base.txt
015  echo 10.0 5.0 >> _inp_base.txt
016  echo 5.0 1.0 >> _inp_base.txt
017  echo "x-distance (m)" >> _inp_base.txt
018  echo "y-distance (m)" >> _inp_base.txt
019
020  f90_GMTheat out_CPT_ondom.csv
021
022
023  del _*
- 001
- To compile the program of 'f90_GMTheat.f90'
- 004-005
- To make the file '_col_mesh.txt.'
Mesh colors are defined by this file, 3 figures means 'R G B' in this file.
In this example, new file is made using command 'echo' in this batch file, and since 2 materials are used (parameter MATEL=2), 2 kinds of color is defined.
- 013-018
- To make the file '_inp_base.txt.'
This file defines the parameters for GMT.
-
| ind | Draw node number and element number in FEM mesh. (0: no, 1: yes) |
| ibc | Draw boundary conditions in FEM mesh. (0: no, 1: yes) |
| baselength | Size of x and y-axis in unit of 'cm' |
| baseheight | Size of z-axis in unit of 'cm' |
| bavx | Value of 'a' in '-B' option for x and y-axis on GMT |
| bfvx | Value of 'f' in '-B' option for x and y-axis on GMT |
| bavz | Value of 'a' in '-B' option for z-axis on GMT |
| bfvz | Value of 'f' in '-B' option for z-axis on GMT |
| strx | Label for x-axis. Double prime (") is required because of character |
| stry | Label for y-axis. Double prime (") is required because of character |
- Note) label for z-axis is fixed character 'Temperature.'
- 020
- To execute the program 'f90_GMTheat.exe.' Functions of this 'exe' file are to make the batch file 'bat_gmt_xyz.bat' and to execute it by calling built-in subroutine 'system(***).'
- Input file 'out_CPT_ondom.csv' which storages the result of FEM analysis is read from command line of command prompt on Windows.
- Output drawings are shown below.
-
| Filename | Description | Remarks |
|---|
| fig_gmt_mesh.eps | FEM mesh drawing in eps format | Output filename is fixed. |
| fig_gmt_xyz_xx.eps | 3D temperature distribution drawing in eps format | Output filename is fixed. 'xx' means time history. |
-
| Symbols for boundary conditions in FEM mesh drawing |
|---|
| Symbol | Description |
|---|
| ○ | Boundary of given temperature |
| △ | Boundary of heat transfer side |
- 023
- To delete work files
Programs and drawings
Source code by f90 and batch file for execution
sample drawing of the temperature around the tunnel
below samples shows the temperature variation around tunnel in rock area. Average temperature of year is 10°C, amplitude of temperature change in year is ±10°C.
Expression of result of seepage flow analysis
Outline
This program can show the FEM mesh, pressure head contour map, total head contour map and flow velocity vector map by using GMT.
Fortran program (f90_GMTseep.f90)
Some explanations are shown below.
- FEM mesh is drawn by specifying the coordinates of each element and repeating painting out of each element and drawing of each element boundary line.
- The contour map is created in the following procedures.
- Creation of the mask file which defines the element existence domain by 'grdmask' command.
- Creation of the grid file for contours by 'surface' command.
- Creation of the grid file for plot by composition of the mask file and the grid file by 'grdmath' command.
- Coloring by 'grdimage' command and contour drawing by 'grdcontour' command.
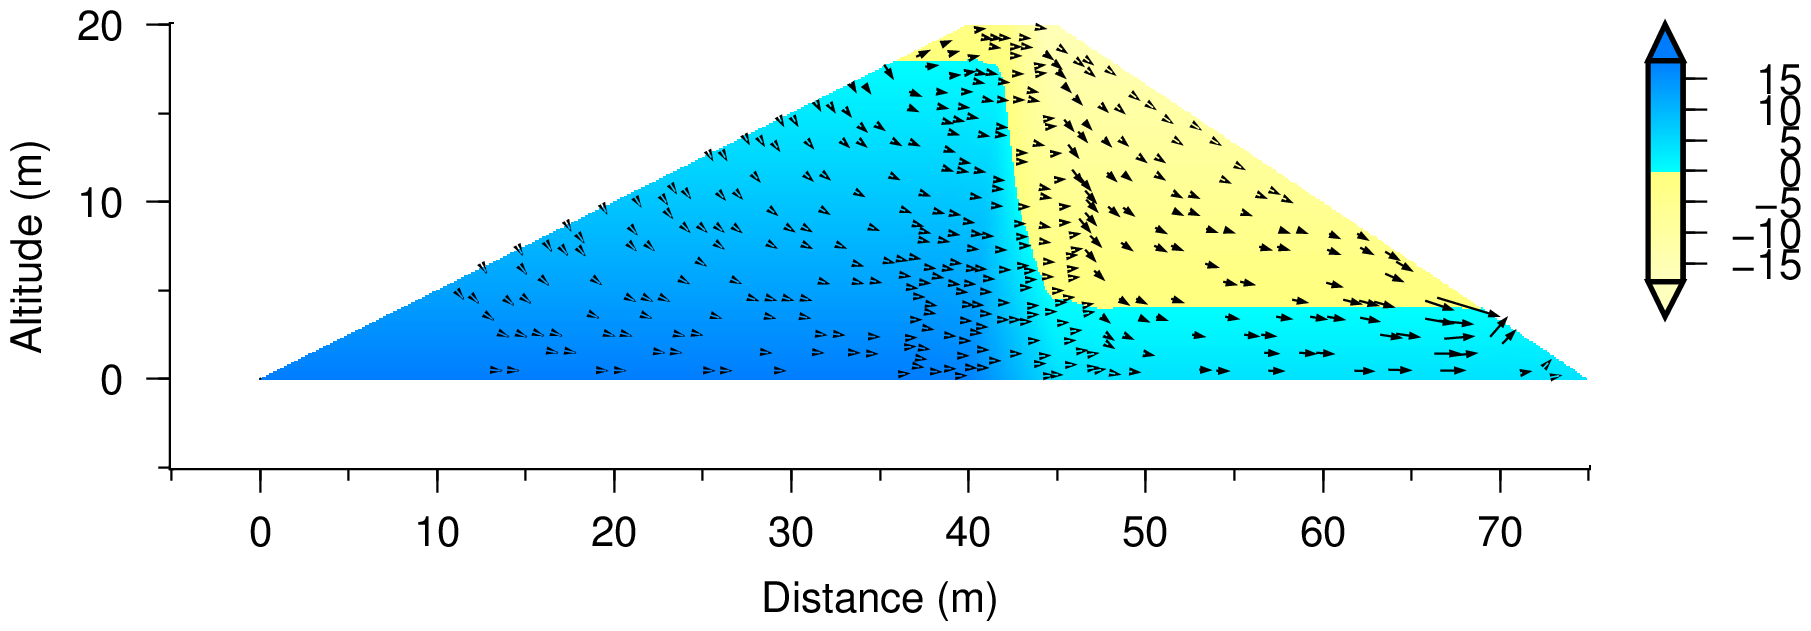
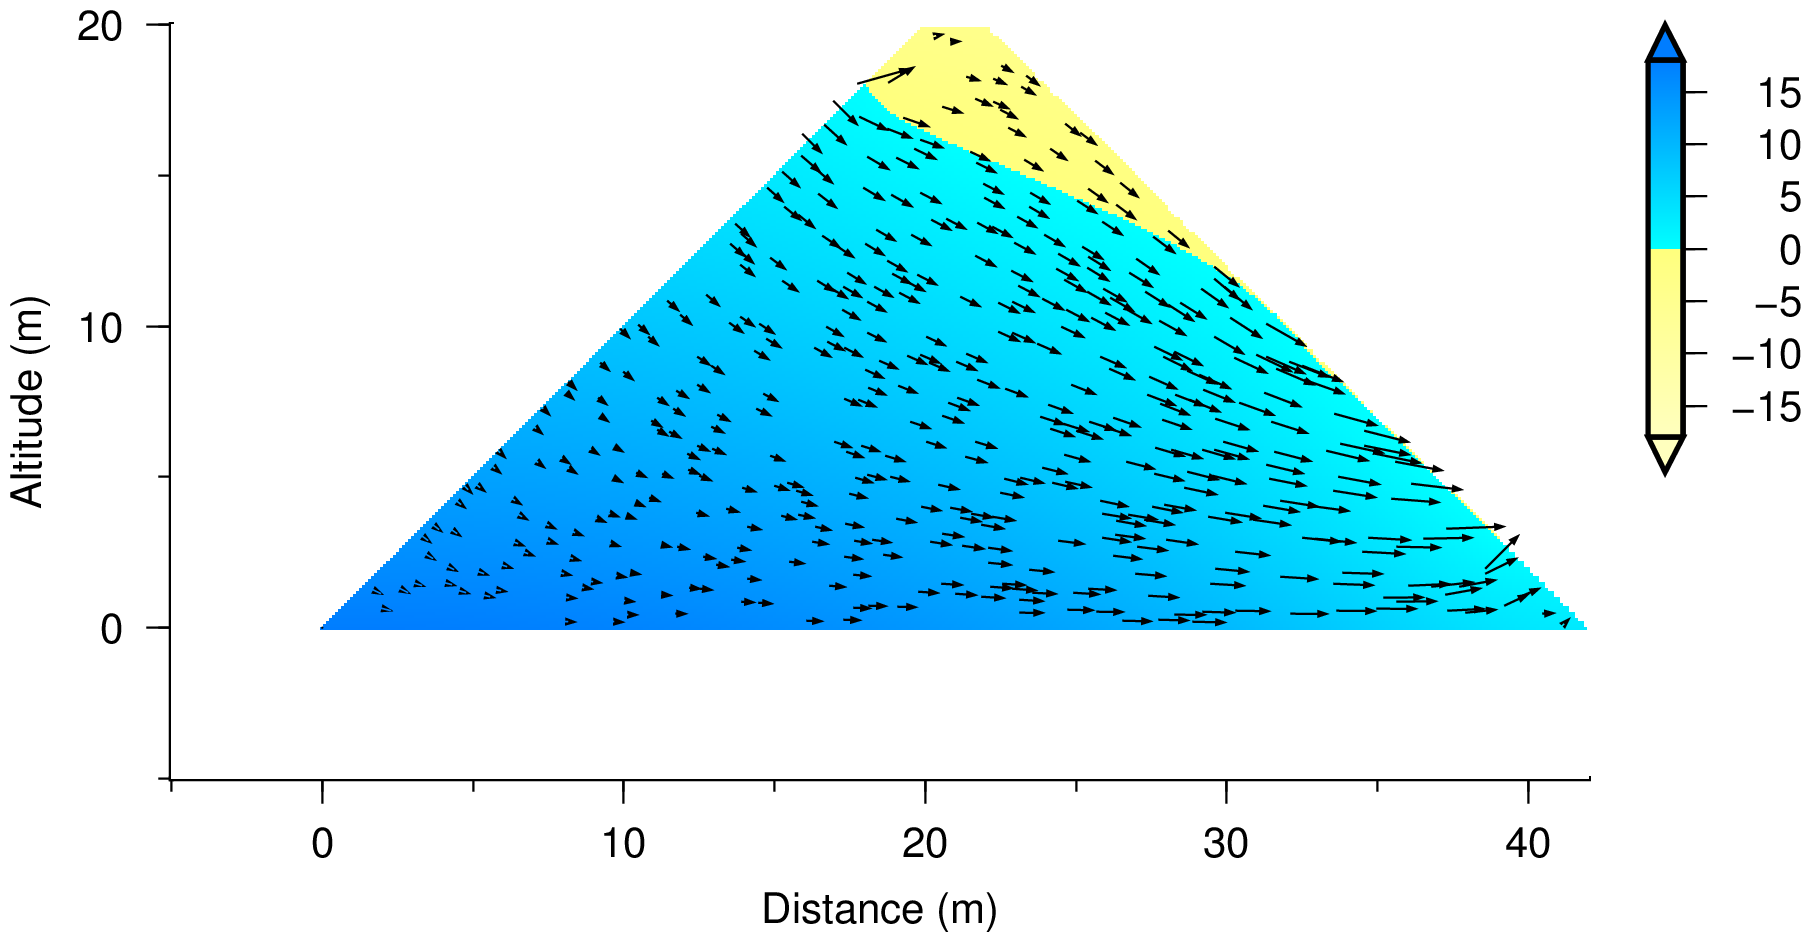
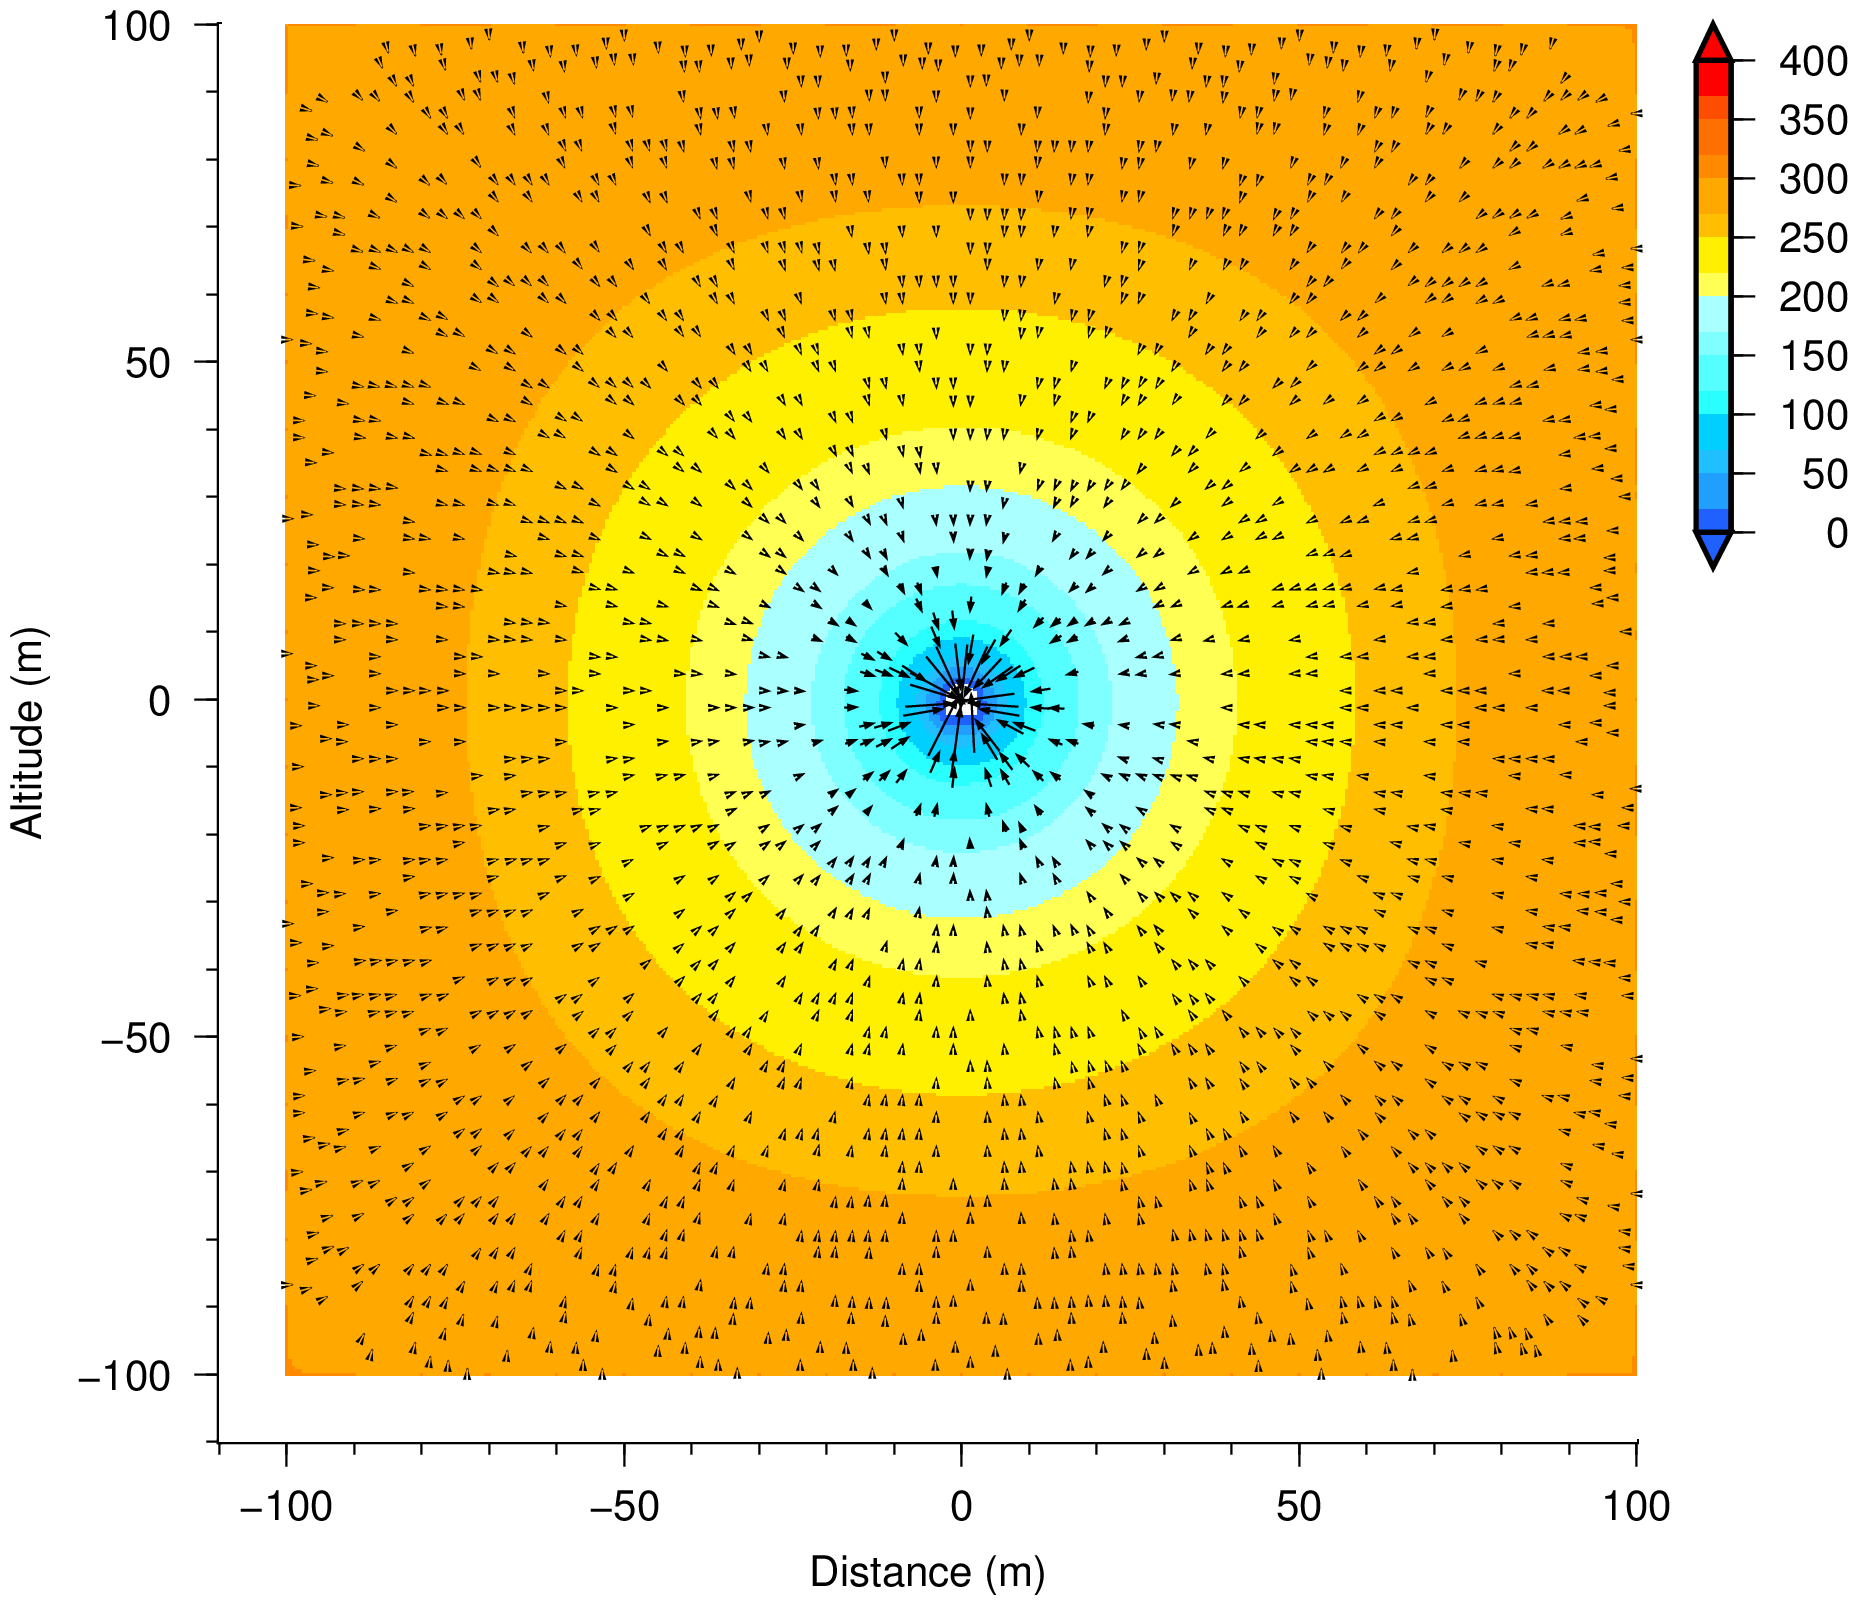
- The vector diagram is created by superimposing the arrow of the flow velocity vector on the colored map of the pressure head or total head generated by contour creation.
- In addition, since a figure will become ugly if the flow velocity vector is drawn on all elements, in this example, the flow velocity vector is drawn once per three elements.
Following files must be prepared before execution of the program.
| Filename | Description | Remarks |
|---|
| _col_mesh.txt | Input file for defining mesh color | Filename is fixed |
| _inp_base.txt | Input file for drawing information | Filename is fixed |
| 0_cpt.cpt | Input cpt file for reading by GMT | Filename is fixed |
| out_fem_zone4m.csv | Output file by FEM analysis | Filename is changeable |
Output file by FEM analysis is a output by the program 'f90_FEM_SEEP.exe' made by webmaster.
Batch file which carries out the process is shown below.
Some files which are read from Fortran program are made in this batch file.
001  gfortran -o f90_GMTseep.exe f90_GMTseep.f90
002
003  copy 0_cpt_dam.cpt 0_cpt.cpt
004
005  rem define of mesh color (1:MATEL)
006  echo 255 255 204 > _col_mesh.txt
007  echo   0 255 255 >> _col_mesh.txt
008  echo 255   0 255 >> _col_mesh.txt
009  echo   0 255 255 >> _col_mesh.txt
010  echo 255 255 204 >> _col_mesh.txt
011
012  rem integer::ind,ibc,iph,ivc,isc
013  rem real(4)::baselength,grdspc
014  rem real(4)::bav,bfv
015  rem real(4)::conint,annint
016  rem character::strx*100,strz*100
017  echo 0 1 1 1 1 > _inp_base.txt
018  echo 12.0 0.1 >> _inp_base.txt
019  echo 10.0 5.0 >> _inp_base.txt
020  echo  1.0 5.0 >> _inp_base.txt
021  echo "Distance (m)" >> _inp_base.txt
022  echo "Altitude (m)" >> _inp_base.txt
023
024  f90_GMTseep out_fem_zone4m.csv
025  copy fig_gmt_mesh.eps fig_gmt_mesh_dam.eps
026  copy fig_gmt_conp.eps fig_gmt_conp_dam.eps
027  copy fig_gmt_vect.eps fig_gmt_vect_dam.eps
028
029  del fig_gmt_mesh.eps
030  del fig_gmt_conp.eps
031  del fig_gmt_conh.eps
032  del fig_gmt_vect.eps
033  del _*
- 001
- To compile the program 'f90_GMTseep.f90'
- 003
- To copy '0_cpt_dam.cpt' which has been prepared beforehand to '0_cpt.cpt.'
- 006-010
- To make the file '_col_mesh.txt.'
Mesh colors are defined by this file, 3 figures means 'R G B' in this file.
In this example, new file is made using command 'echo' in this batch file, and since 5 materials are used (parameter MATEL=5), 5 kinds of color is defined.
- 017-022
- To make the file '_inp_base.txt.'
This file defines the parameter for GMT.
-
| ind | Draw node number and element number in FEM mesh. (0: no, 1: yes) |
| ibc | Draw boundary conditions in FEM mesh. (0: no, 1: yes) |
| iph | Superimpose total head line on pressure head contour, or reverse. (0: no, 1: yes) |
| ivc | Specify the kind of contour map superimposed on velocity vector map (1: pressure head contour, 2: total head contour) |
| isc | Draw scale map for contour (0: no, 1: yes) |
| baselength | Size of drawing in unit of 'cm' |
| grdspc | Mesh interval for 'grd' file |
| bav | Value of 'a' in '-B' option for x and y-axis on GMT |
| bfv | Value of 'f' in '-B' option for x and y-axis on GMT |
| conint | Value of interval of contour in '-C' option of 'grdcontour' command |
| annint | value of interval of tickmark in '-A' option of 'grdcontour' command |
| strx | Label for x(horizontal)-axis. Double prime (") is required because of character |
| strz | Label for z(vertical)-axis. Double prime (") is required because of character |
- 024
- To execute the program 'f90_GMTseep.exe.' Functions of this exe file are to make the batch file 'bat_gmt_seep.bat' and to execute it by calling built-in subroutine 'system(***).'
- Input file 'out_fem_zone4m.csv' which storages the result of FEM analysis is read from command line of command prompt on Windows.
- Output drawings are shown below.
-
| Filename | Description | Remarks |
|---|
| fig_gmt_mesh.eps | FEM mesh drawing in eps format | Output filename is fixed |
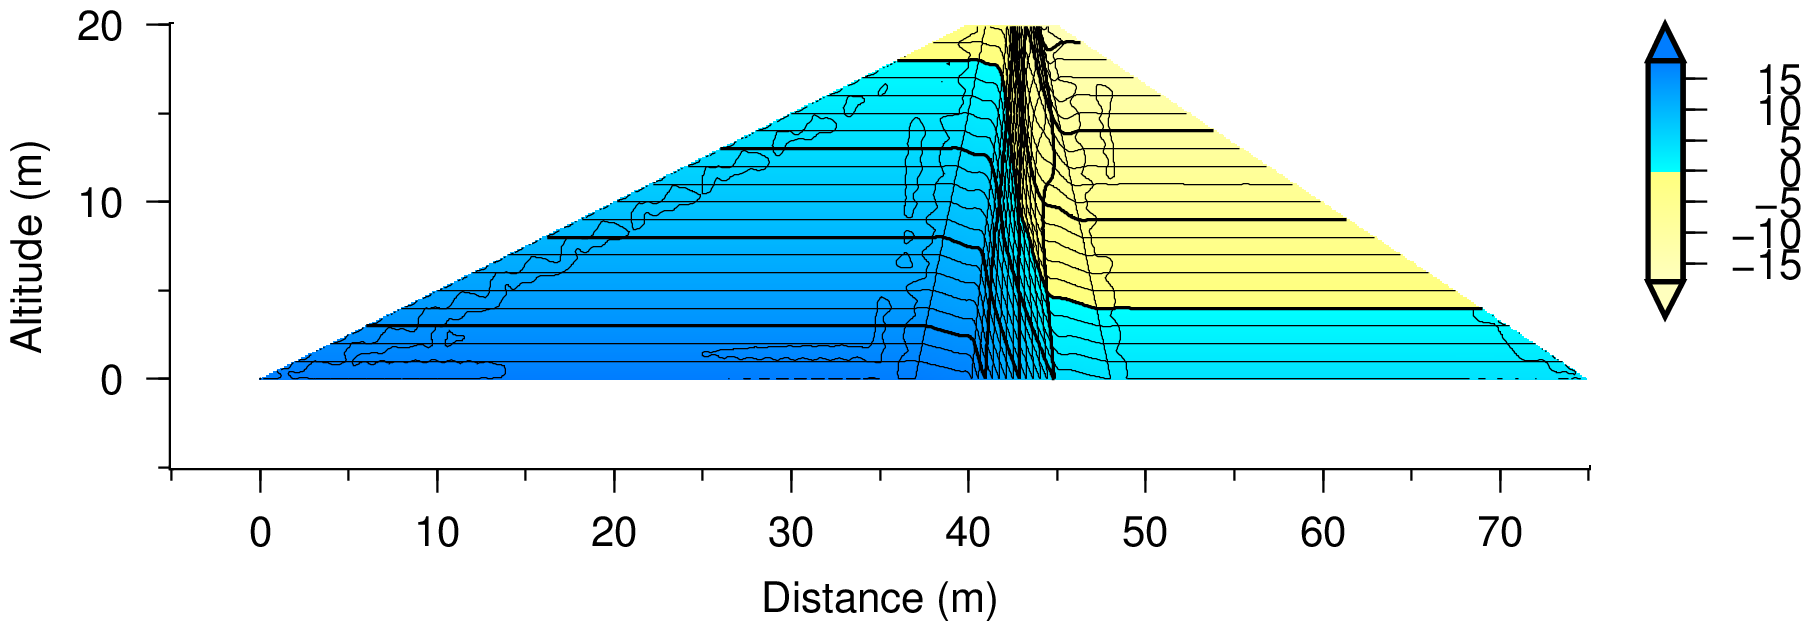
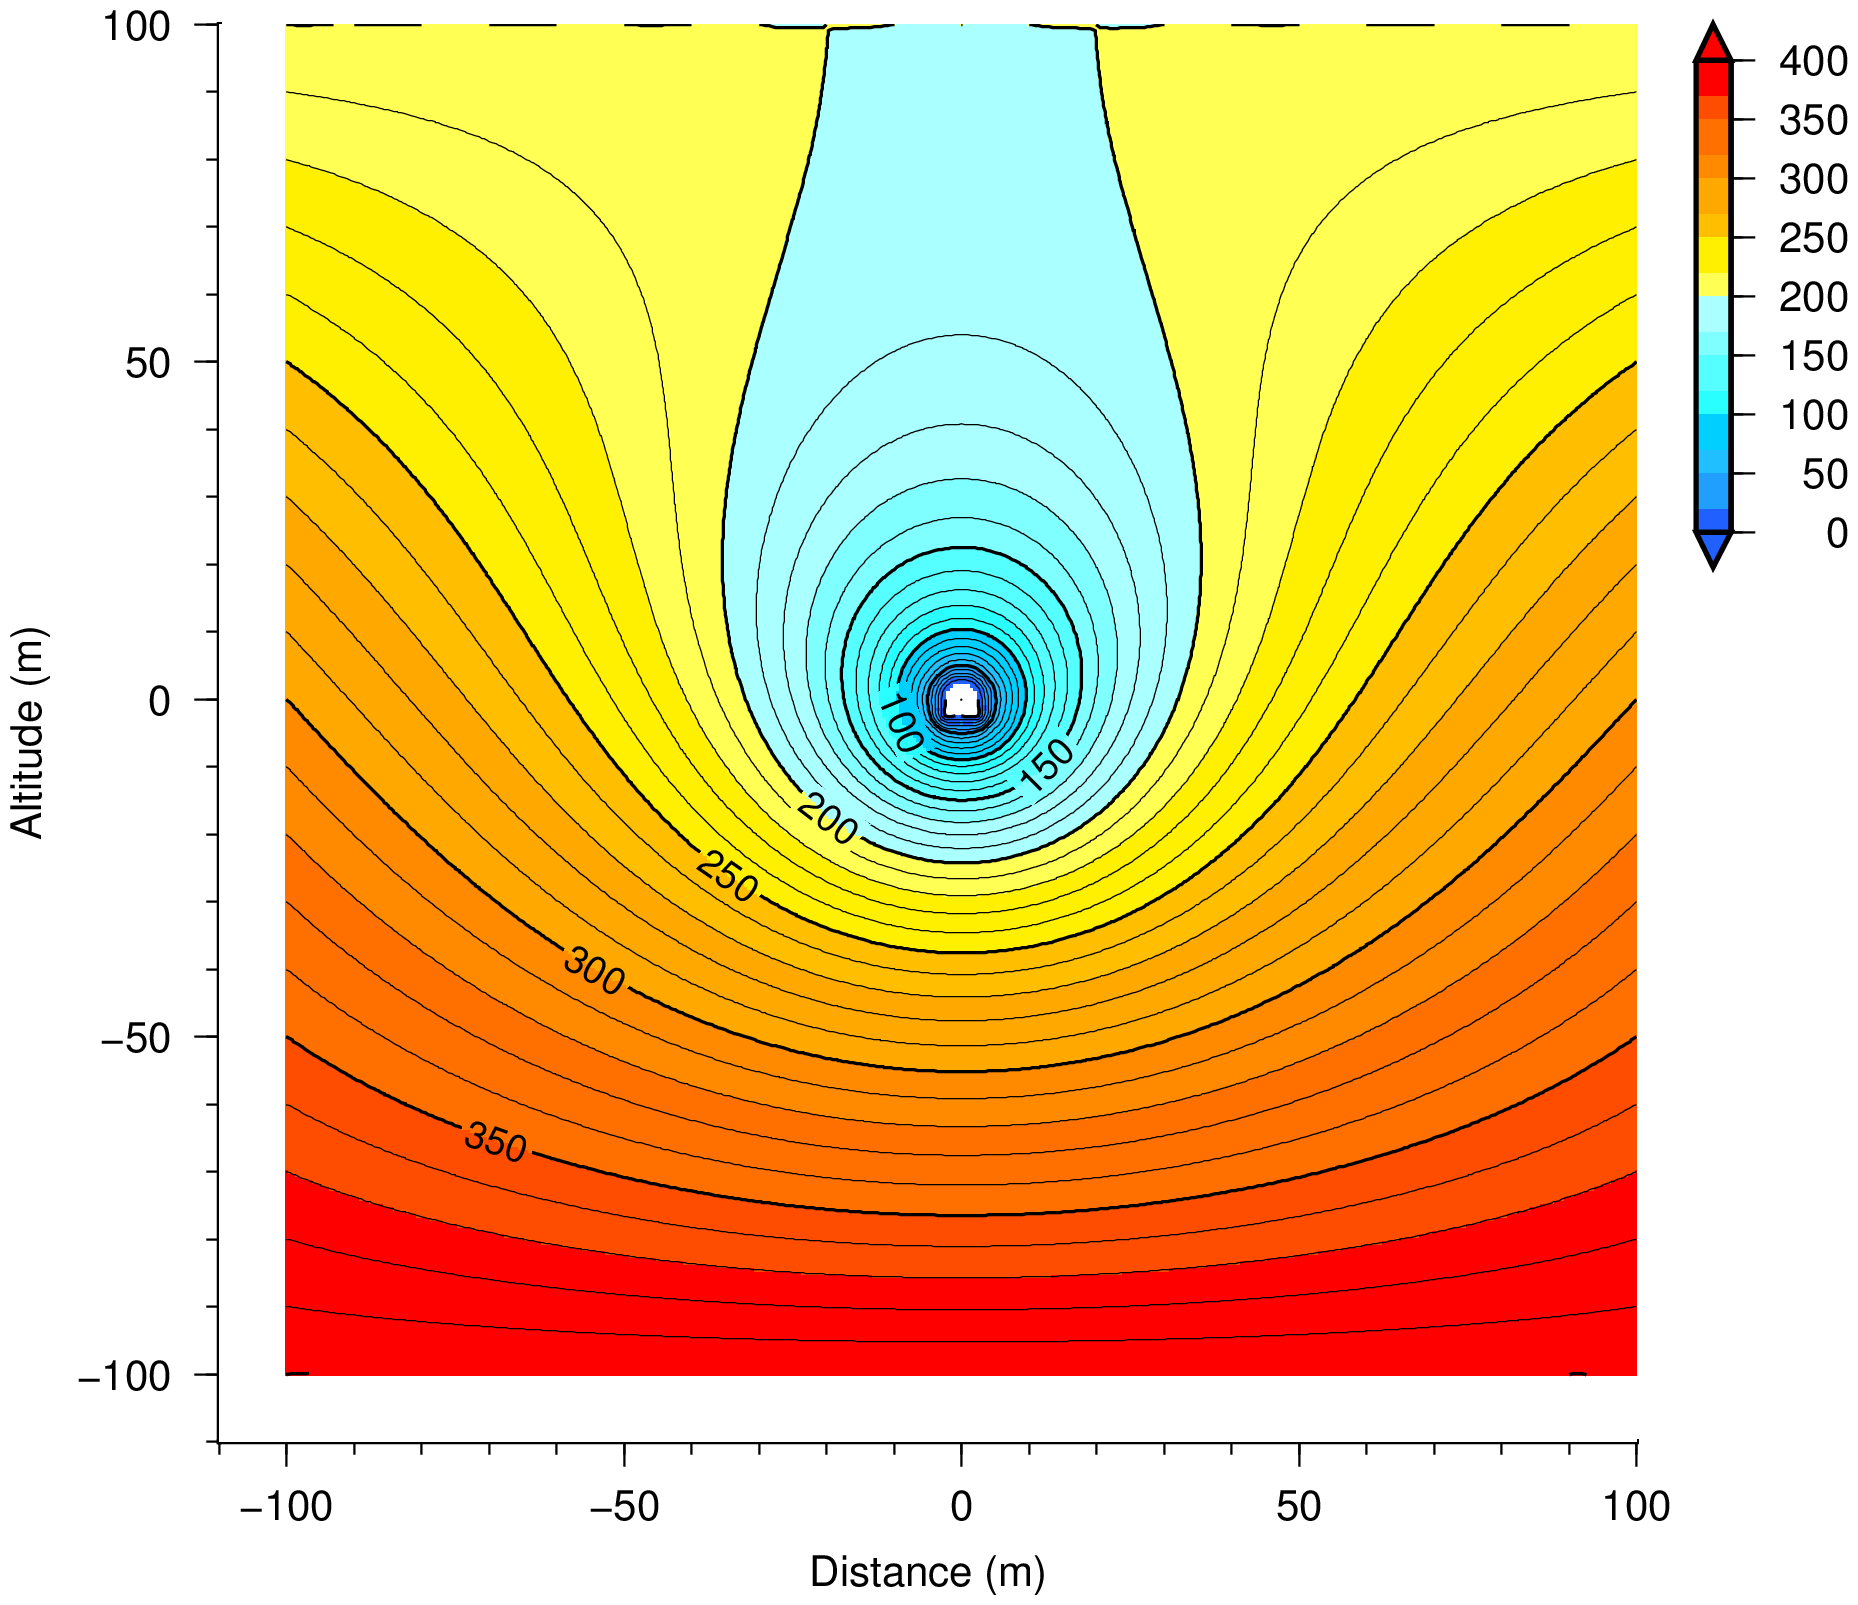
| fig_gmt_conp.eps | Pressure head contour map in eps format | Output filename is fixed |
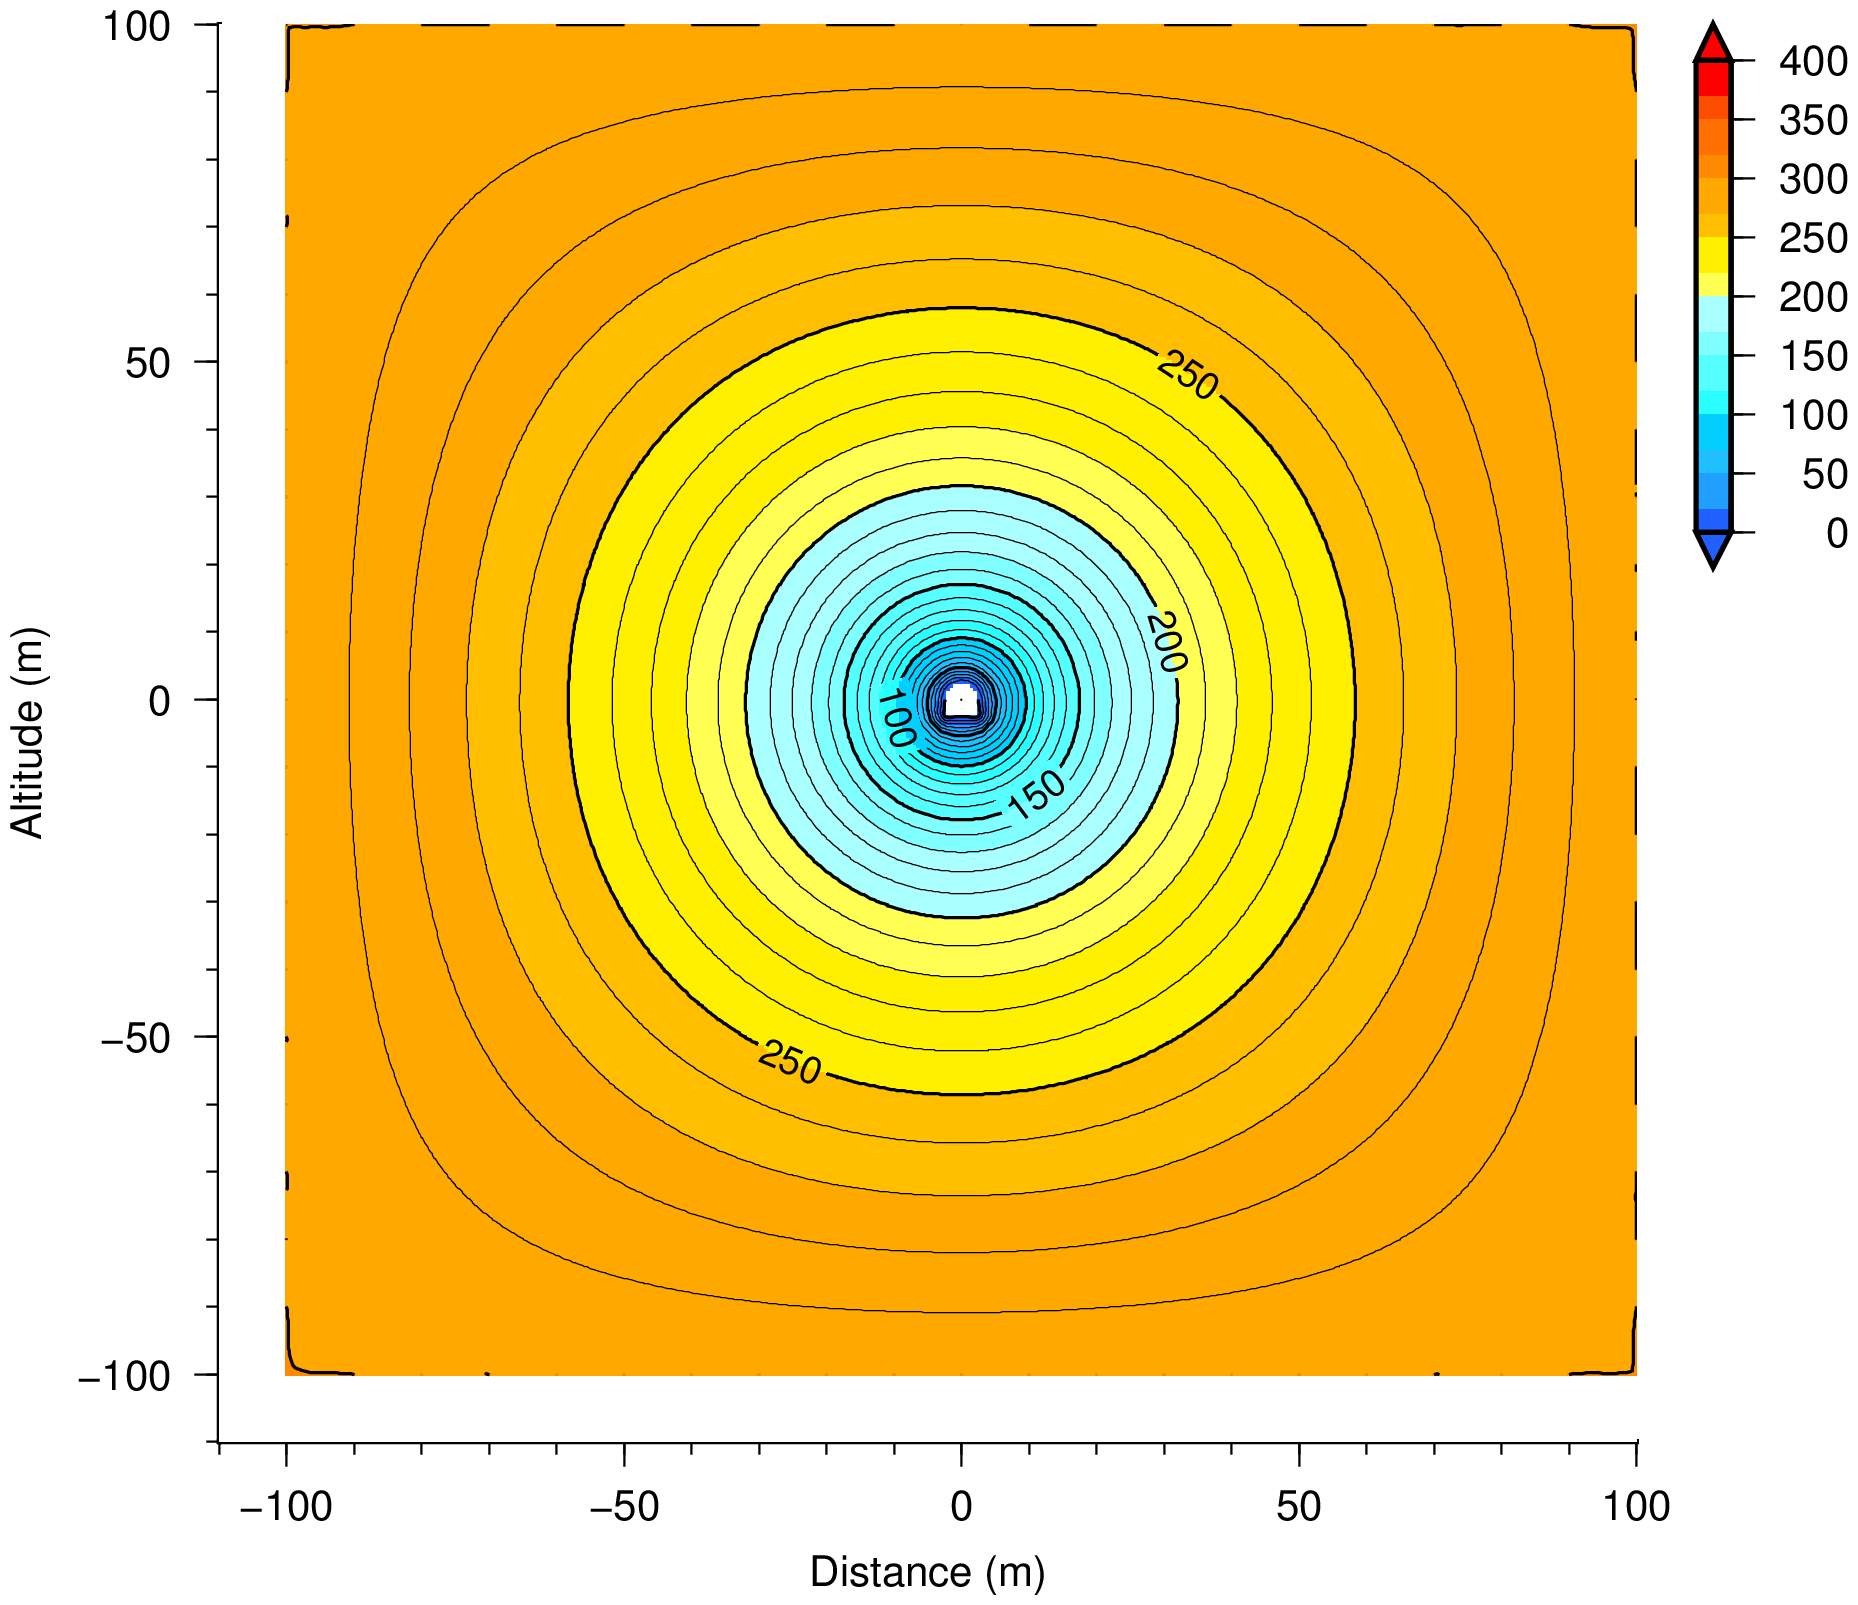
| fig_gmt_conh.eps | Total head contour map in eps format | Output filename is fixed |
| fig_gmt_vect.eps | Velocity vector map in eps format. | Output filename is fixed |
-
| Symbols for boundary conditions in FEM mesh drawing |
|---|
| Symbol | Description |
|---|
| □ | Boundary of given total head |
| ○ | Boundary of given discharge |
| △ | Boundary of seepage surface |
- 025-027
- Since output filename is fixed, it is necessary to change the output filename into another name by a copy command etc after output.
- 029-033
- To delete work files
Programs and drawings
Source code by f90
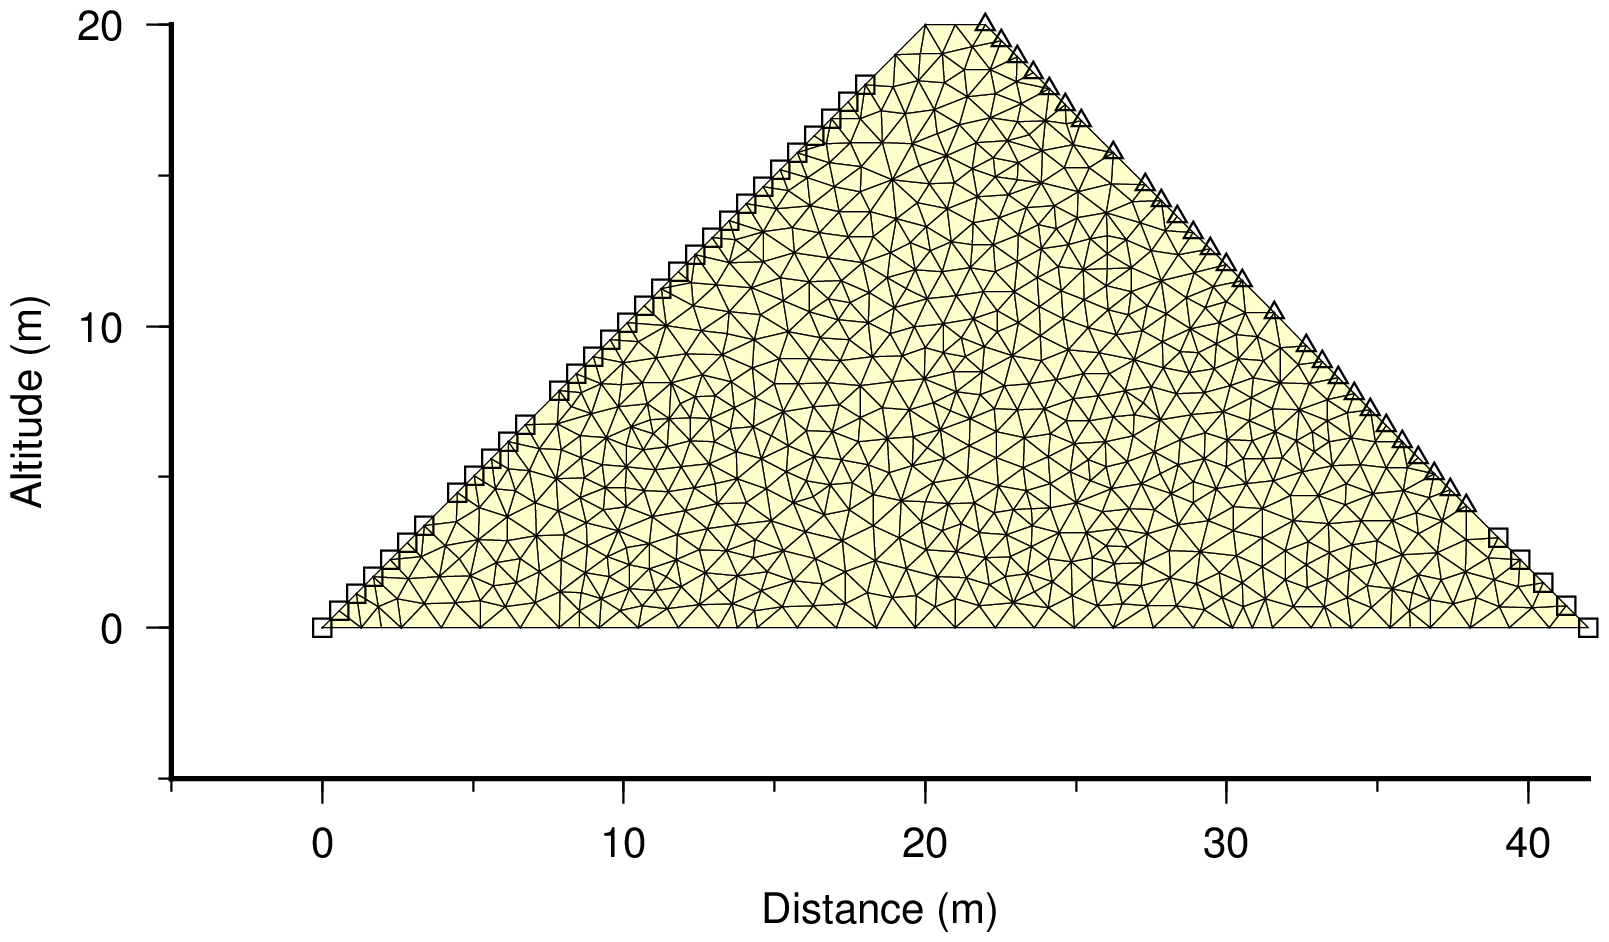
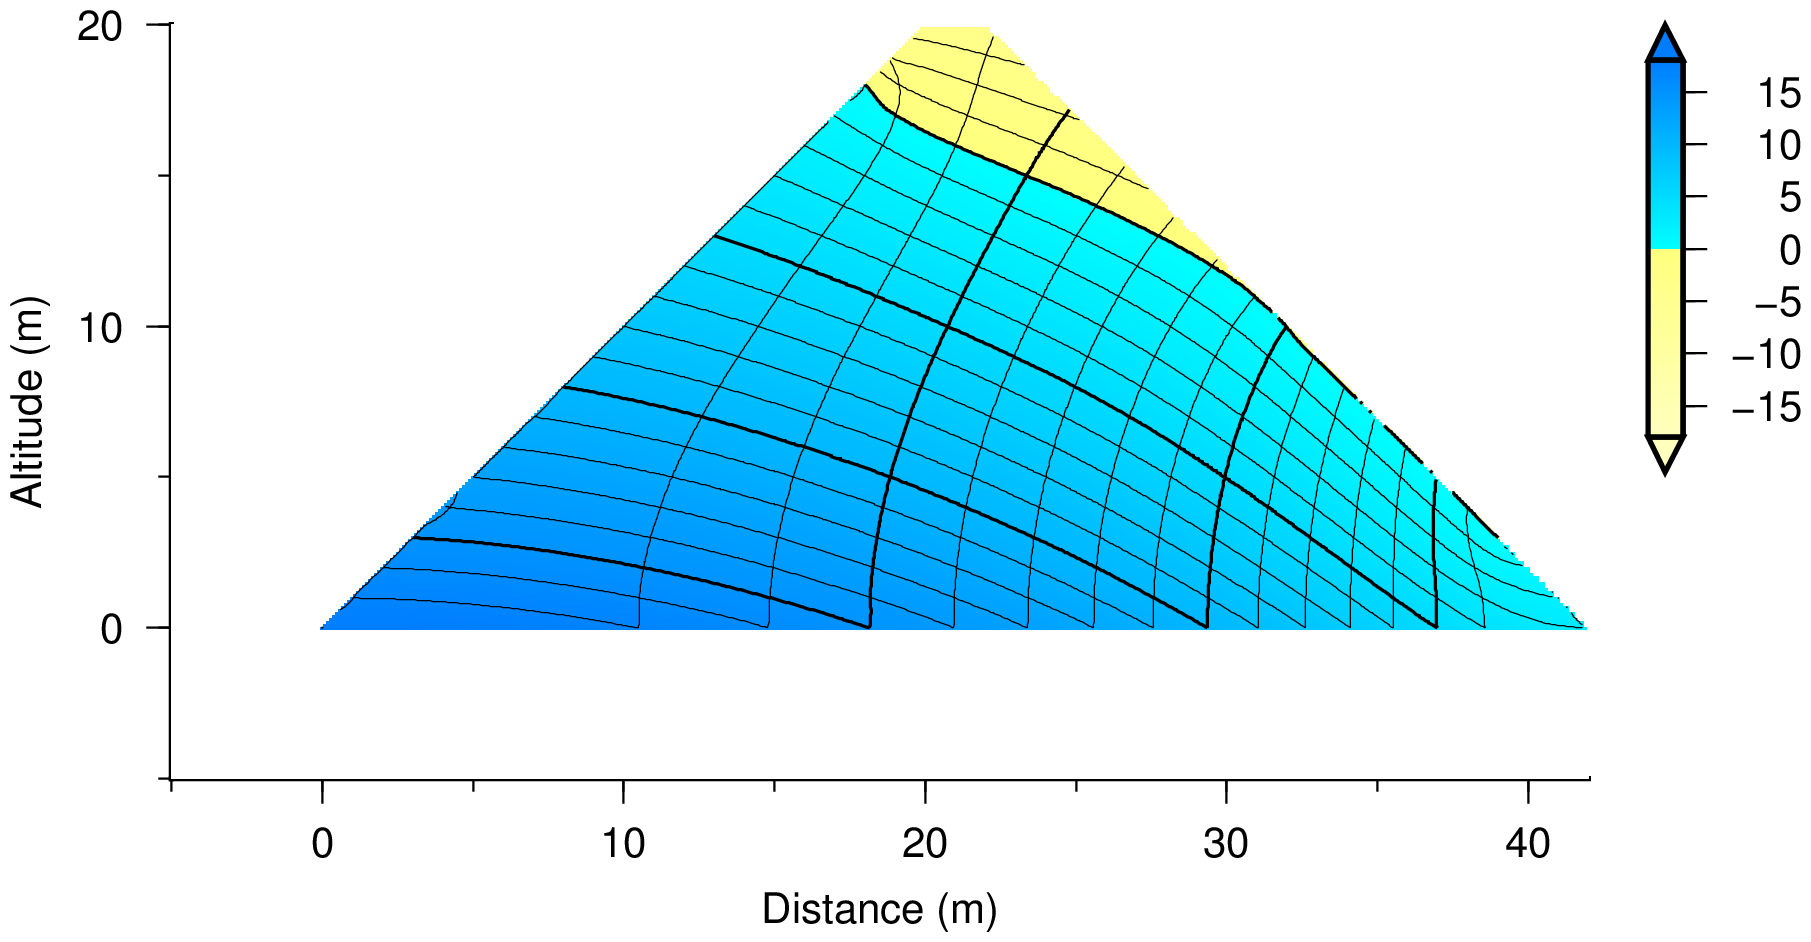
Zoned embankment dam
- This is an example for the zoned embankment dam analysis with 20m-height.
- In this case, water depth of upstream side is 18m and water depth of downstream side is 4m.
- Total heads are given at nodes with symbol of square and seepage conditions are given at nodes with symbol of triangle.
- In addition, it is a well-known fact for zoned embank dam that the free water surface does not drop in the core zone like shown in this alalysis and it drops along the dpwnstream surface of the core zone.
Homogeneous embankment dam
- This is an example for the homogeneous embankment dam analysis with 20m-height.
- In this case, water depth of upstream side is 18m and water depth of downstream side is 4m.
- Total heads are given at nodes with symbol of square and seepage conditions are given at nodes with symbol of triangle.
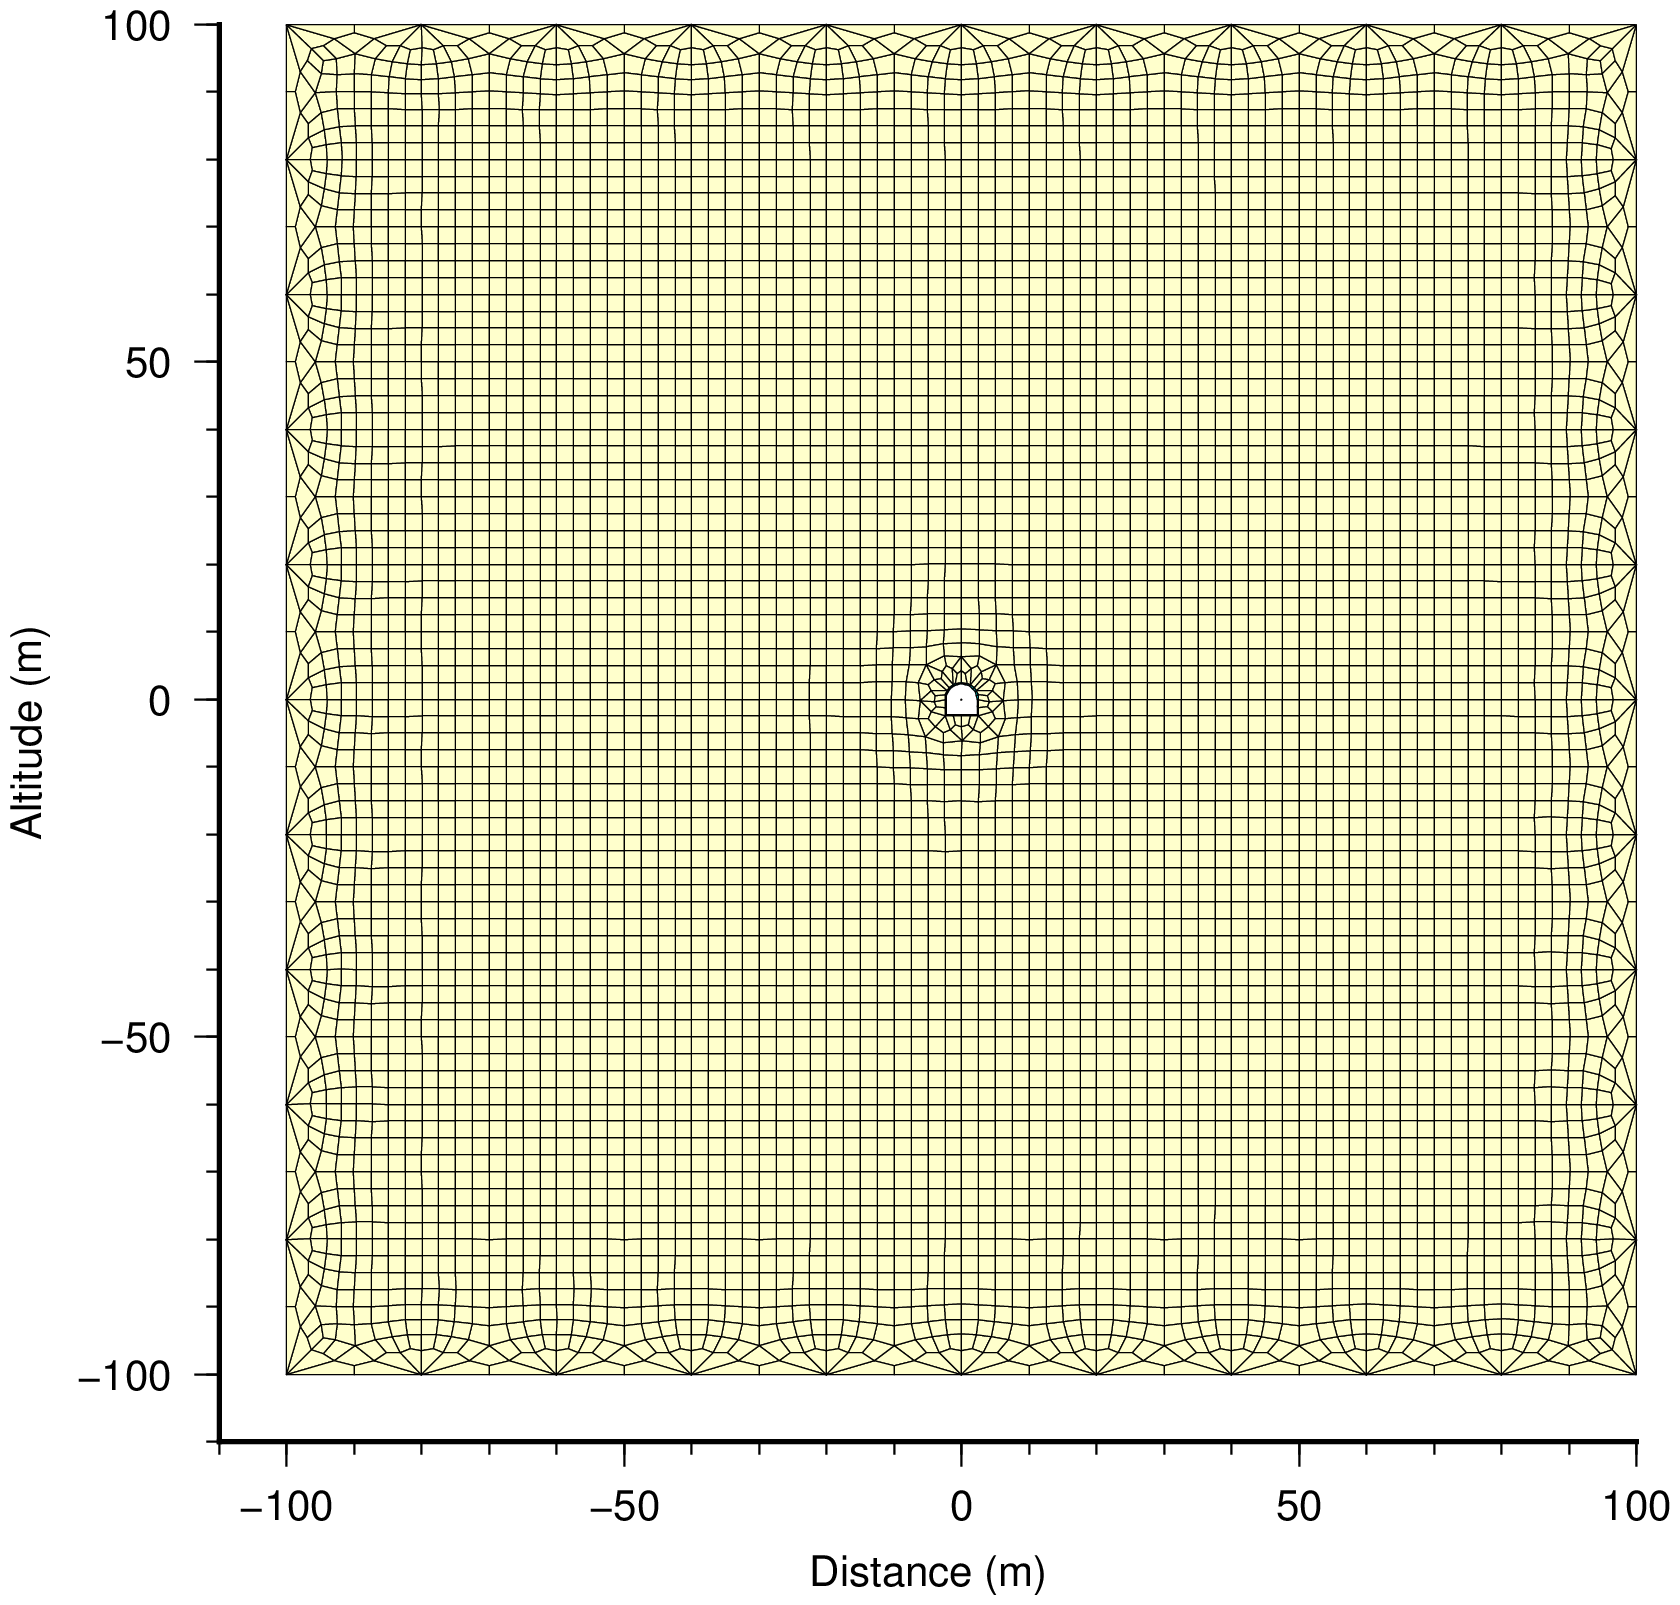
Pressure head distribution around tunnel
- This is an example for the seepage flow analysis around D-shape tunnel with total head of 300m.
- Pressure head at excavated surface of tunnel is zero.
Expression of the result of 2D stress analysis
Outline
This program can show the FEM mesh and principal stress contour maps by using GMT.
Fortran program (f90_GMTplnt.f90)
- About programming, it is almost the same as the program for seepage flow analysis.
- In this program, it is possible to specify the elements (materials) which are not used for contour creation.
- Although the pressure head value or total head value which can be found in seepage flow analysis change continuously, the stress which can be found in stress analysis may not change continuously because of differences of characteristics of materials.
- Then, if all stress values are used for contour creation, unforeseen result may be obtained.
- Therefore, the above-mentioned special treatment is made possible.
Following files must be prepared before execution of the program.
| Filename | Description | Remarks |
|---|
| _col_mesh.txt | Input file for defining mesh color | Filename is fixed |
| _inp_base.txt | Input file for drawing information | Filename is fixed |
| 0_cpt.cpt | Input cpt file for reading by GMT | Filename is fixed |
| out4nodPS0_L.csv | Output file by FEM analysis | Filename is changeable |
Output file by FEM analysis is a output by the program 'f90_FEM_PLNT.exe' made by webmaster.
Batch file which carries out the process is shown below.
Some files which are read from Fortran program are made in this batch file.
001  gfortran -o f90_GMTplnt.exe f90_GMTplnt.f90
002
003  makecpt -Cno_green -T-1/1/0.1 -I > 1_cpt.cpt
004  gawk "{a[NR]=$0}END{for(i=1;i<=NR-1;i++){print a[i]};gsub(/(128)/,\"255\",a[NR]);print a[NR]}" 1_cpt.cpt > 0_cpt.cpt
005
006  rem define of drawing data
007  rem integer::ind,ibc,ifc,isc
008  rem real(4)::baselength,grdspc
009  rem real(4)::bav,bfv
010  rem real(4)::conint,annint
011  rem character::strx*100,stry*100
012  rem integer::ncut,numcut(10)
013  echo 0 1 0 1 > _inp_base.txt
014  echo 12.0 50 >> _inp_base.txt
015  echo 5000.0 5000.0 >> _inp_base.txt
016  echo  0.5 0.5 >> _inp_base.txt
017  echo "x-distance (mm)" >> _inp_base.txt
018  echo "y-distance (mm)" >> _inp_base.txt
019  echo  1 1 >> _inp_base.txt
020
021  rem define of mesh colour (1:MATEL)
022  echo 0,0,0 > _col_mesh.txt
023  echo 255,192,203 >> _col_mesh.txt
024  echo 255,250,205 >> _col_mesh.txt
025
026  f90_GMTplnt out4nodPS0_L.csv
027  copy fig_gmt_mesh.eps fig_gmt_mesh_ps.eps
028  copy fig_gmt_ps1.eps fig_gmt_ps1_ps.eps
029  copy fig_gmt_ps2.eps fig_gmt_ps2_ps.eps
030
031  del fig_gmt_mesh.eps
032  del fig_gmt_ps1.eps
033  del fig_gmt_ps2.eps
034  del _*
- 001
- To compile the program 'f90_GMTplnt.f90'
- 003
- To make file '1_cpt.cpt' by GMT command 'makecpt.'
In this case, 'no_green' is used as the base file, and set range of -1 to 1, set sign as reverse of default.
- 004
- To make file '0_cpt.cpt' using 'gawk.'
In this treatment, the color 'gray' in last row of file '1_cpt.cpt' is changed to the color 'white.'
- 013-019
- To make the file '_inp_base.txt.'
This file defines the parameter for GMT.
-
| ind | Draw node number and element number in FEM mesh. (0: no, 1: yes) |
| ibc | Draw boundary conditions in FEM mesh. (0: no, 1: yes) |
| ifc | draw load conditions in FEM mesh. (0: no, 1: yes) |
| isc | Draw scale map for contour. (0: no, 1: yes) |
| baselength | Size of drawing in unit of 'cm' |
| grdspc | Mesh interval for 'grd' file |
| bav | Value of 'a' in '-B' option for x and y-axis on GMT |
| bfv | Value of 'f' in '-B' option for x and y-axis on GMT |
| conint | Value of inteval of contour in '-C' option of 'grdcontour' command |
| annint | value of interval of tickmark in '-A' option of 'grdcontour' command |
| strx | Label for x(horizontal)-axis. Double prime (") is required because of character |
| stry | Label for y(vertical)-axis. Double prime (") is required because of character |
| ncut | Number of materials which are not use in contour creation. In this case, it is 'one' for steel penstock. |
| numcut(i) | Material number which is no use in contour creation. In this case, it is 'one' for material number of steel penstock.
It is necessary to define 'ncut' and 'numcut' in 1 row. |
- 022-024
- To make the file '_col_mesh.txt.'
Mesh colors are defined by this file, 3 figures means 'R G B' in this file.
In this example, new file is made using command 'echo' in this batch file, and since 3 materials are used (parameter MATEL=3), 3 kinds of color is defined.
- 026
- To execute the program 'f90_GMTplnt.exe.' Functions of this exe file are to make the batch file 'bat_gmt_plnt.bat' and to execute it by calling built-in subroutine 'system(***).'
- Input file 'out_4nodPS0_L.csv' which storages the result of FEM analysis is read from command line of command prompt on Windows.
- Output drawings are shown below.
-
| Filename | Description | Remarks |
|---|
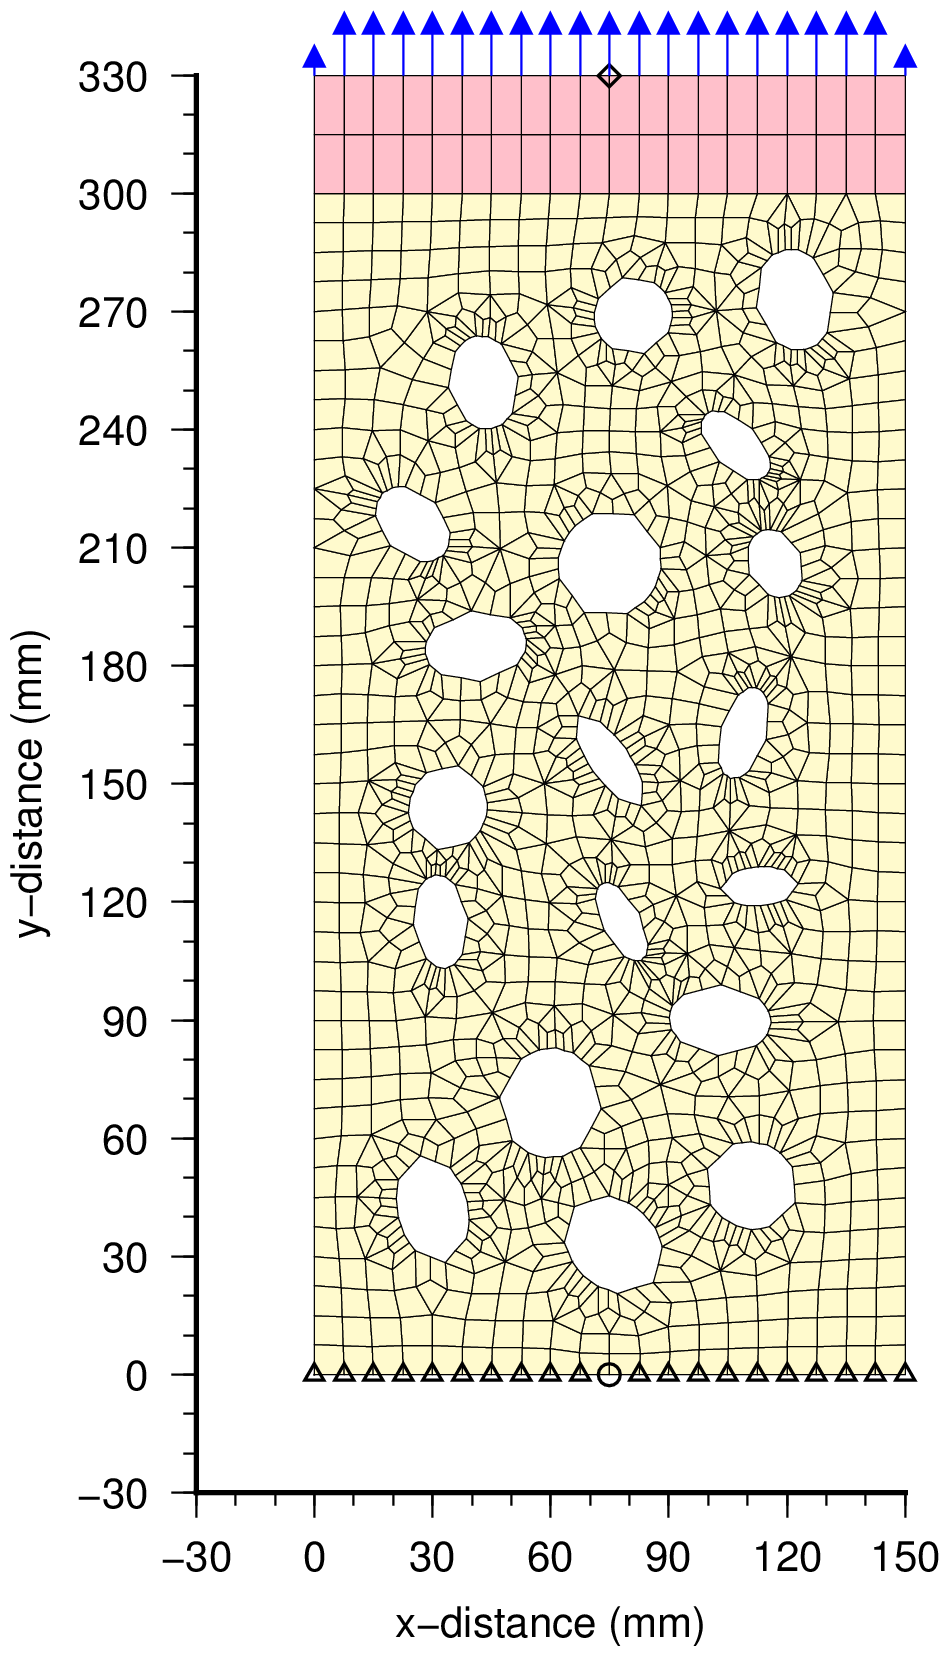
| fig_gmt_mesh.eps | FEM mesh in eps format | filename is fixed |
| fig_gmt_ps1.eps | 1st principal stress contour in eps format | filename is fixed |
| fig_gmt_ps2.eps | 2nd principal stress contour in eps format | filename is fixed |
-
| Symbols for boundary conditions in FEM mesh drawing |
|---|
| Symbol | Description |
|---|
| ◇ | Boundary of given displacement in x-direction |
| △ | Boundary of given displacement in y-direction |
| ○ | Boundary of given displacement in both of x and y-directions |
- 027-029
- Since output filename is fixed, it is necessary to change the output filename into another name by a copy command etc after output.
- 031-034
- To delete work files.
Programs and drawings
Source code by f90
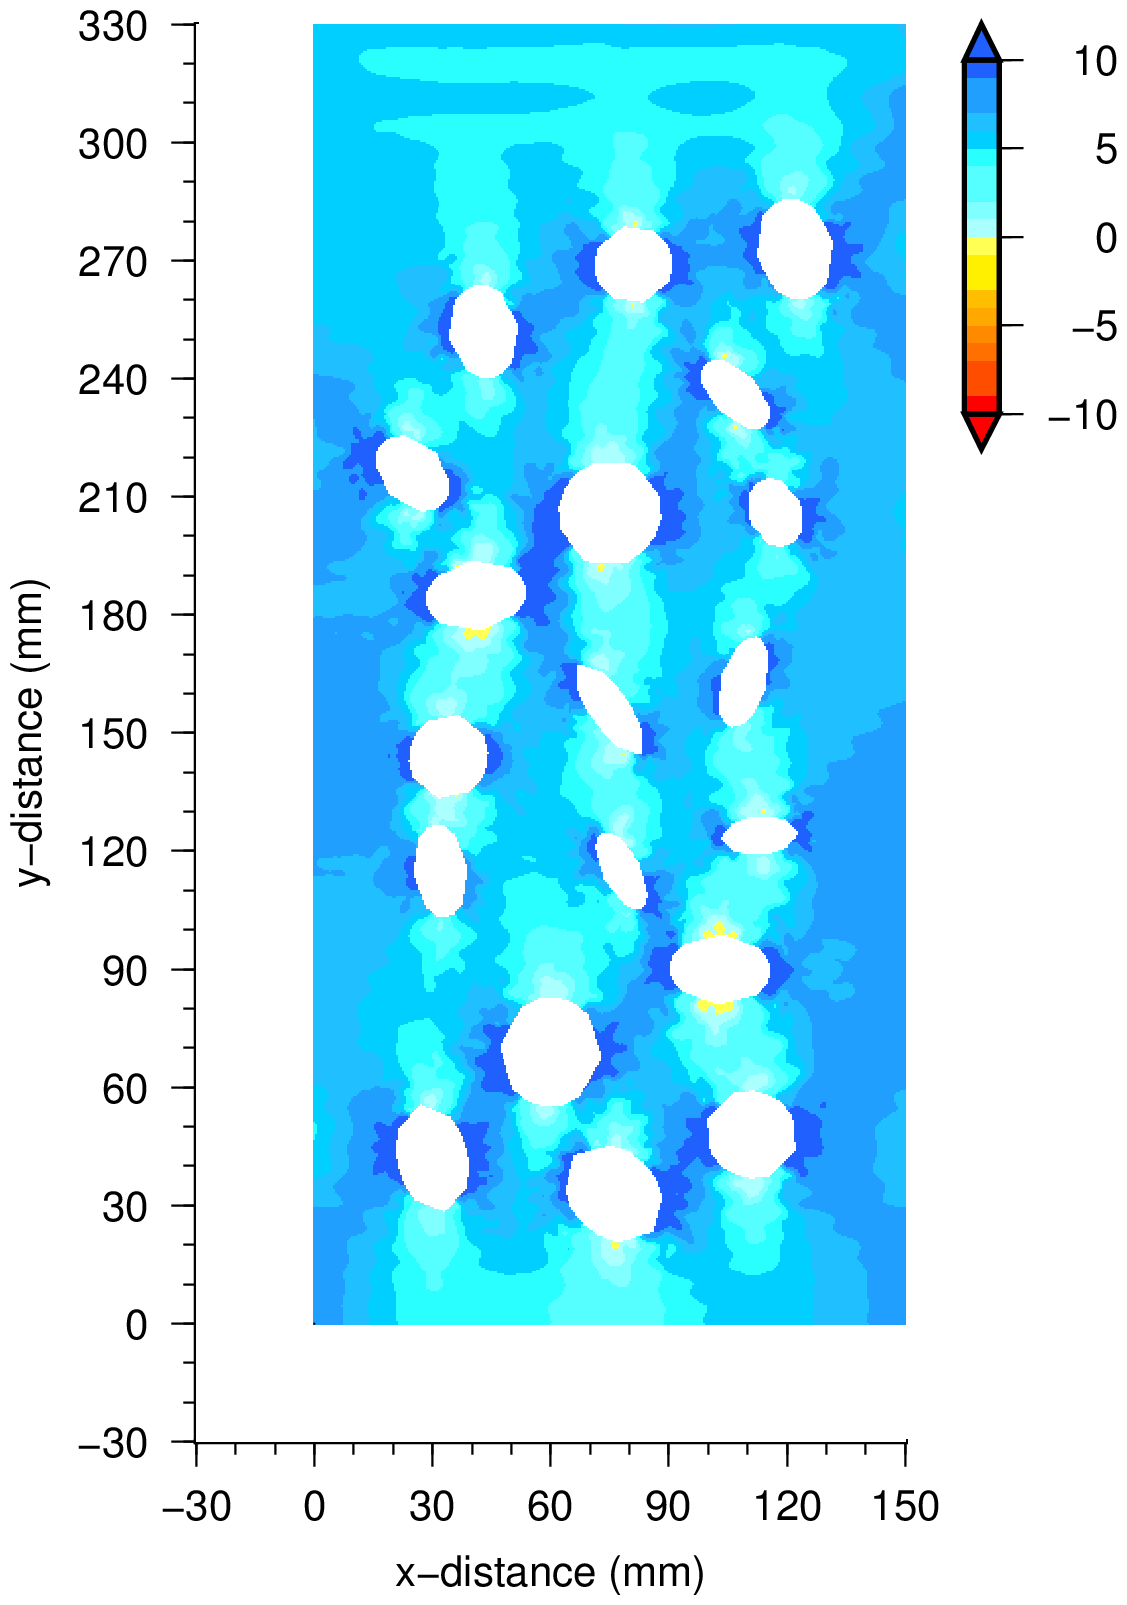
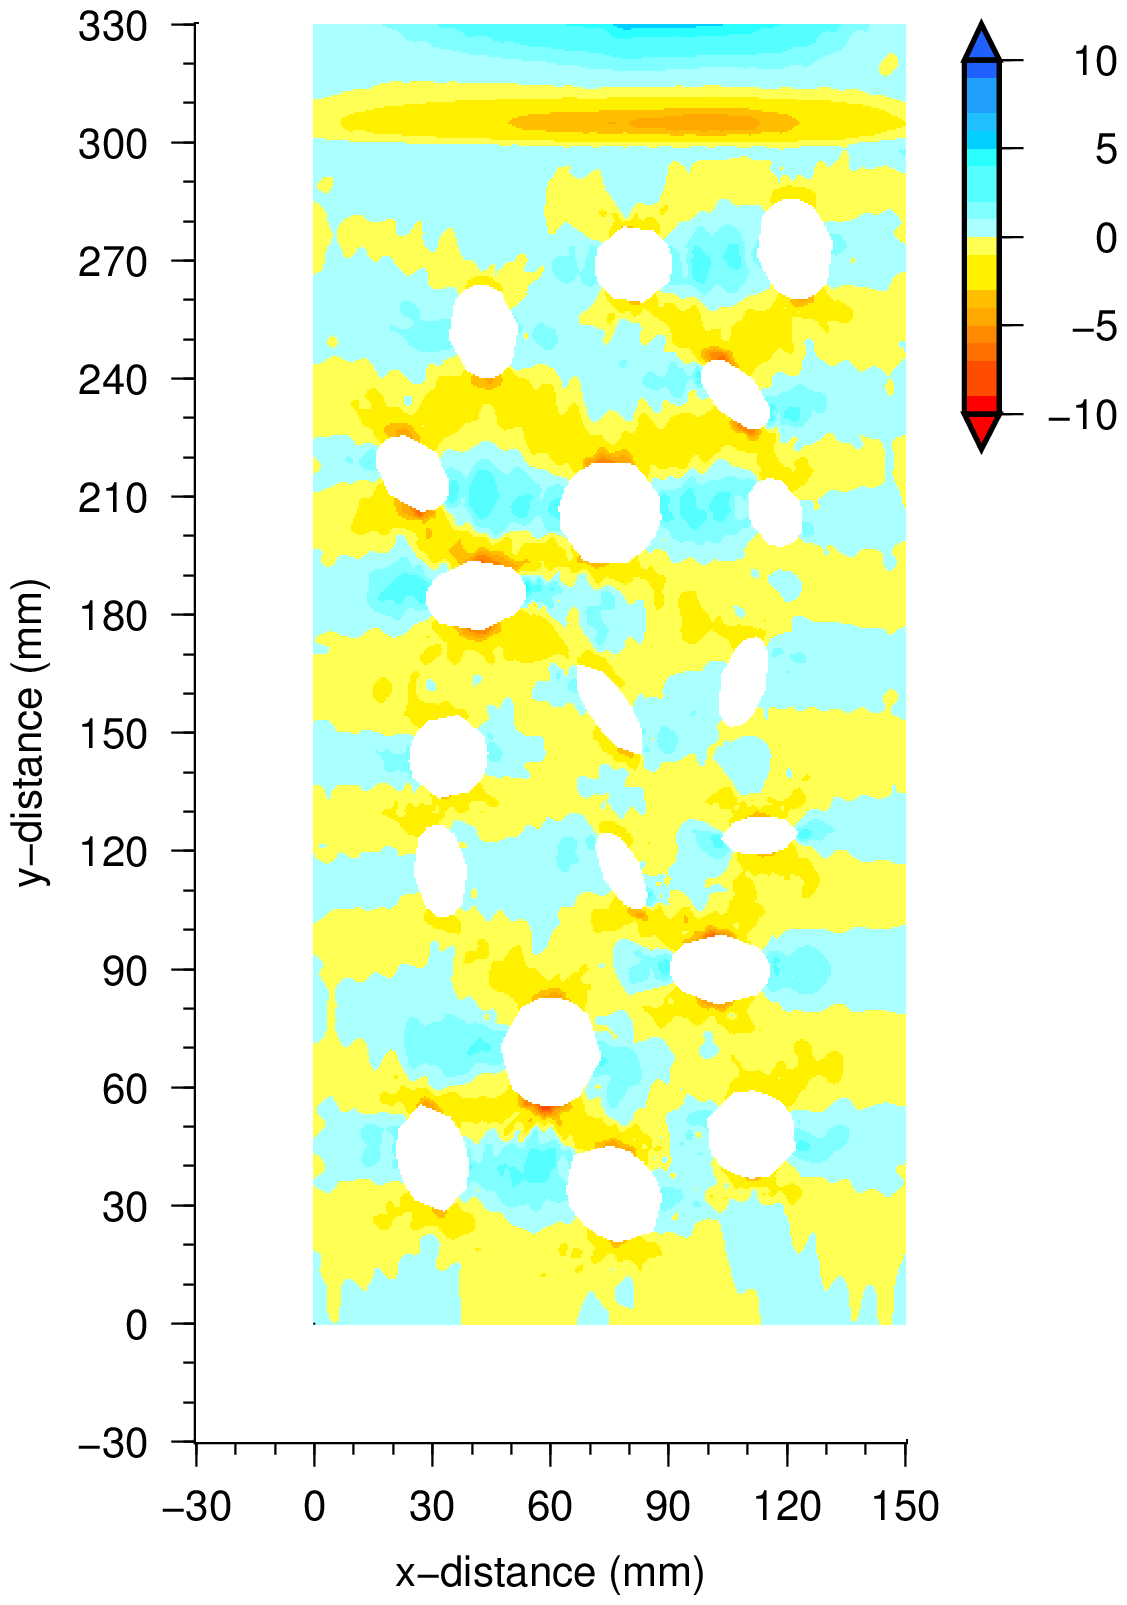
Example of principal stress distribution of plate with holes under uniform tension
An example of principal stress distribution of plate with holes under uniform tension is shown in this section.
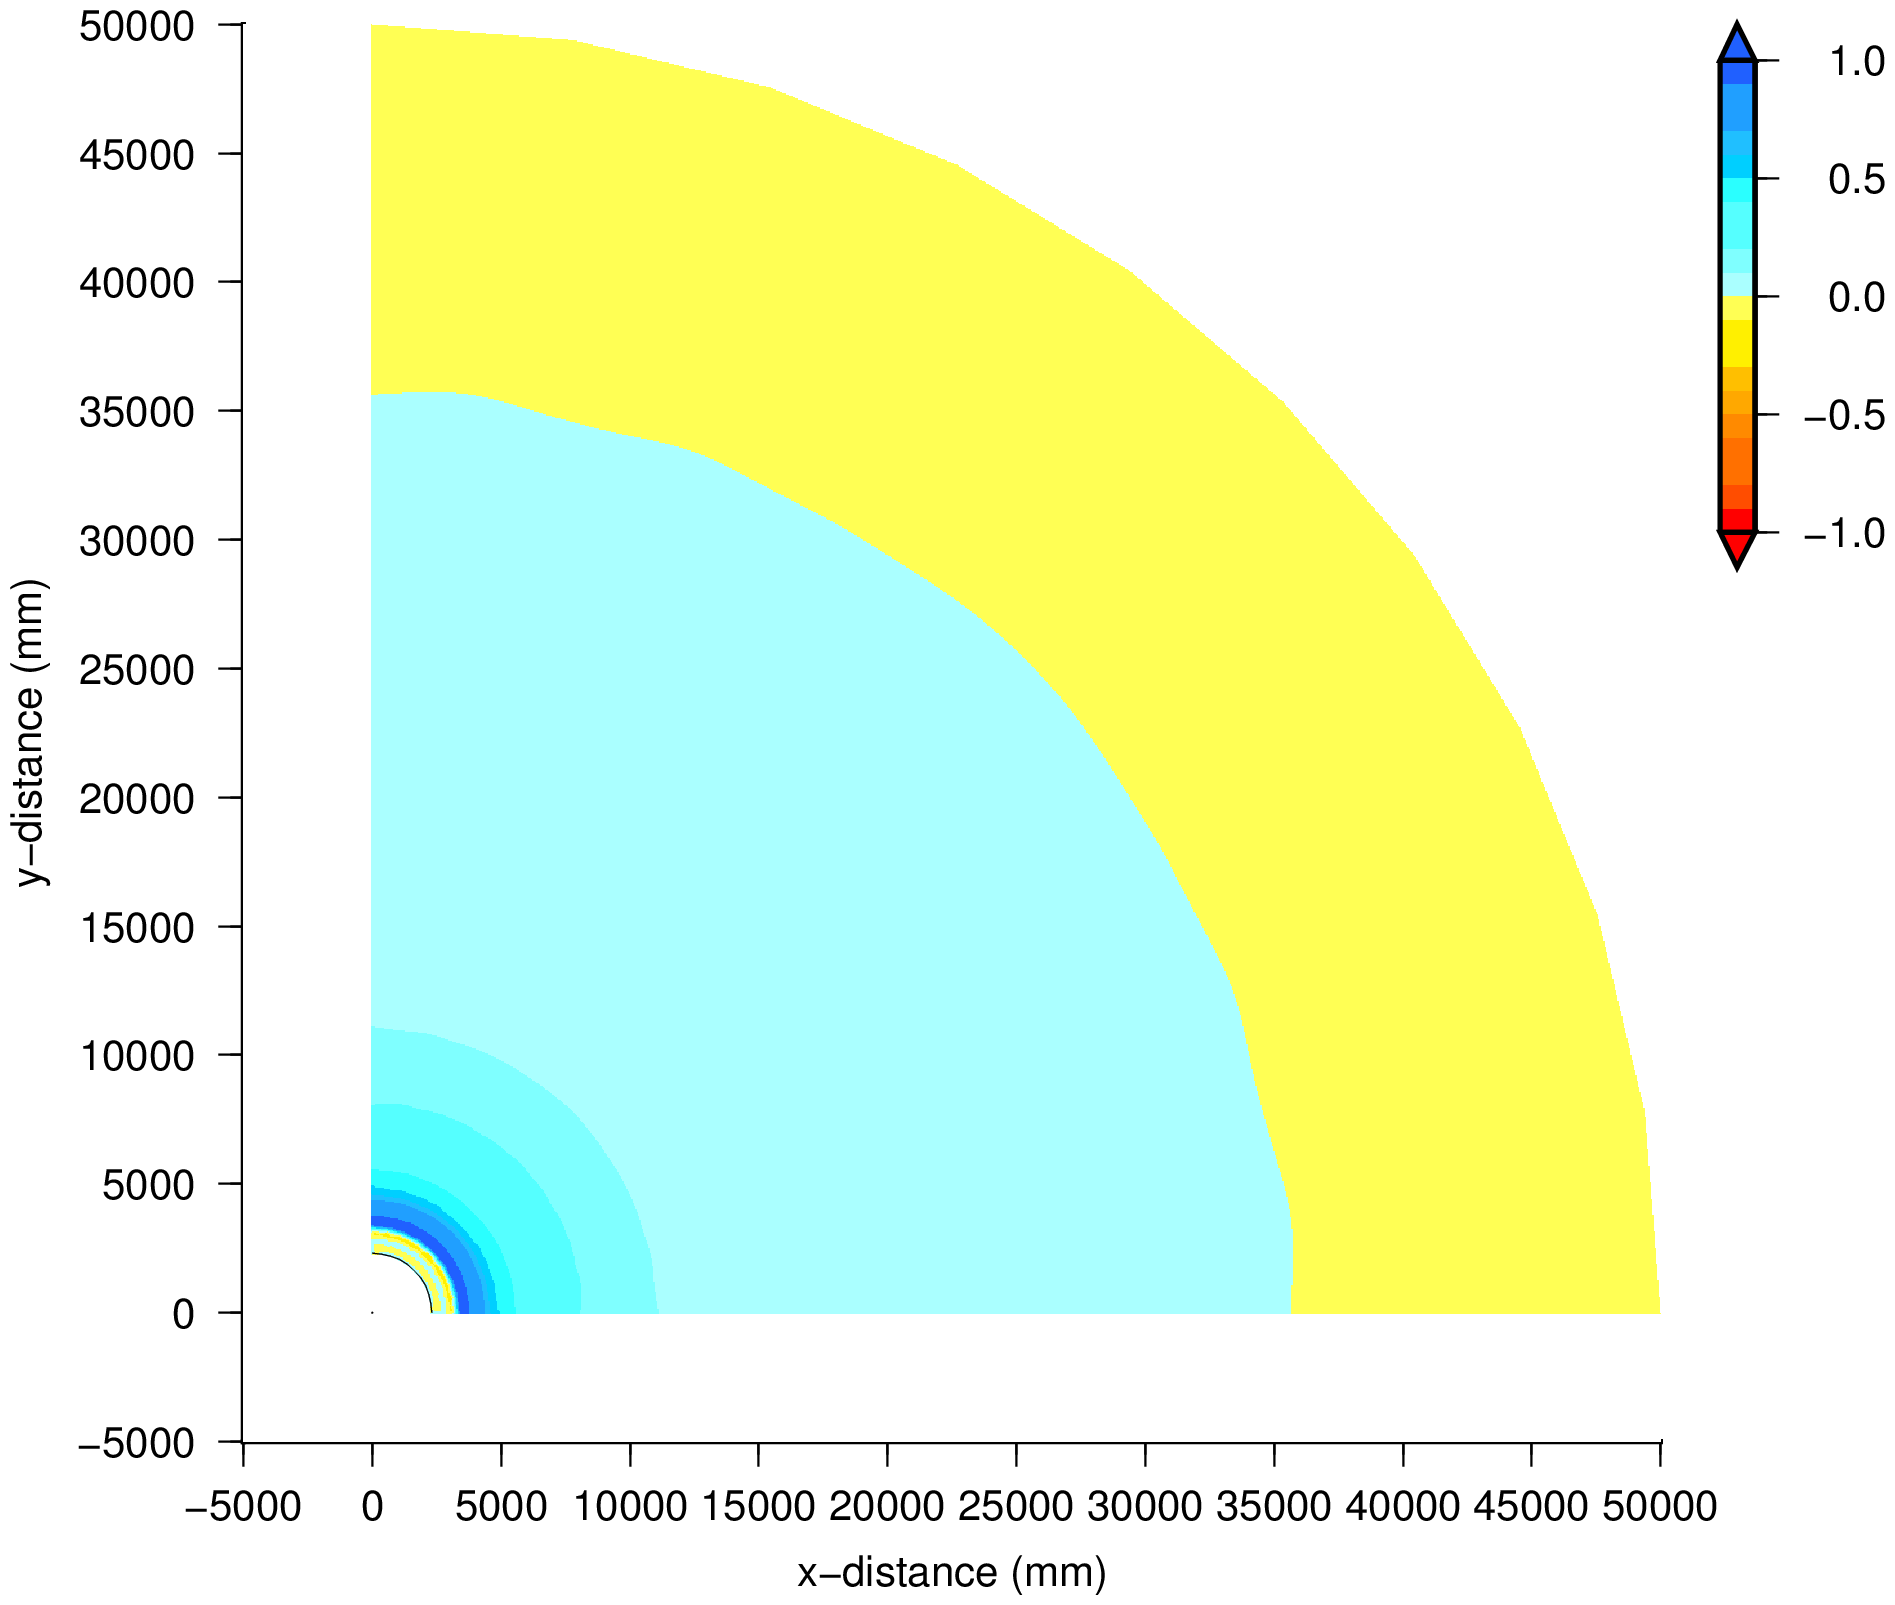
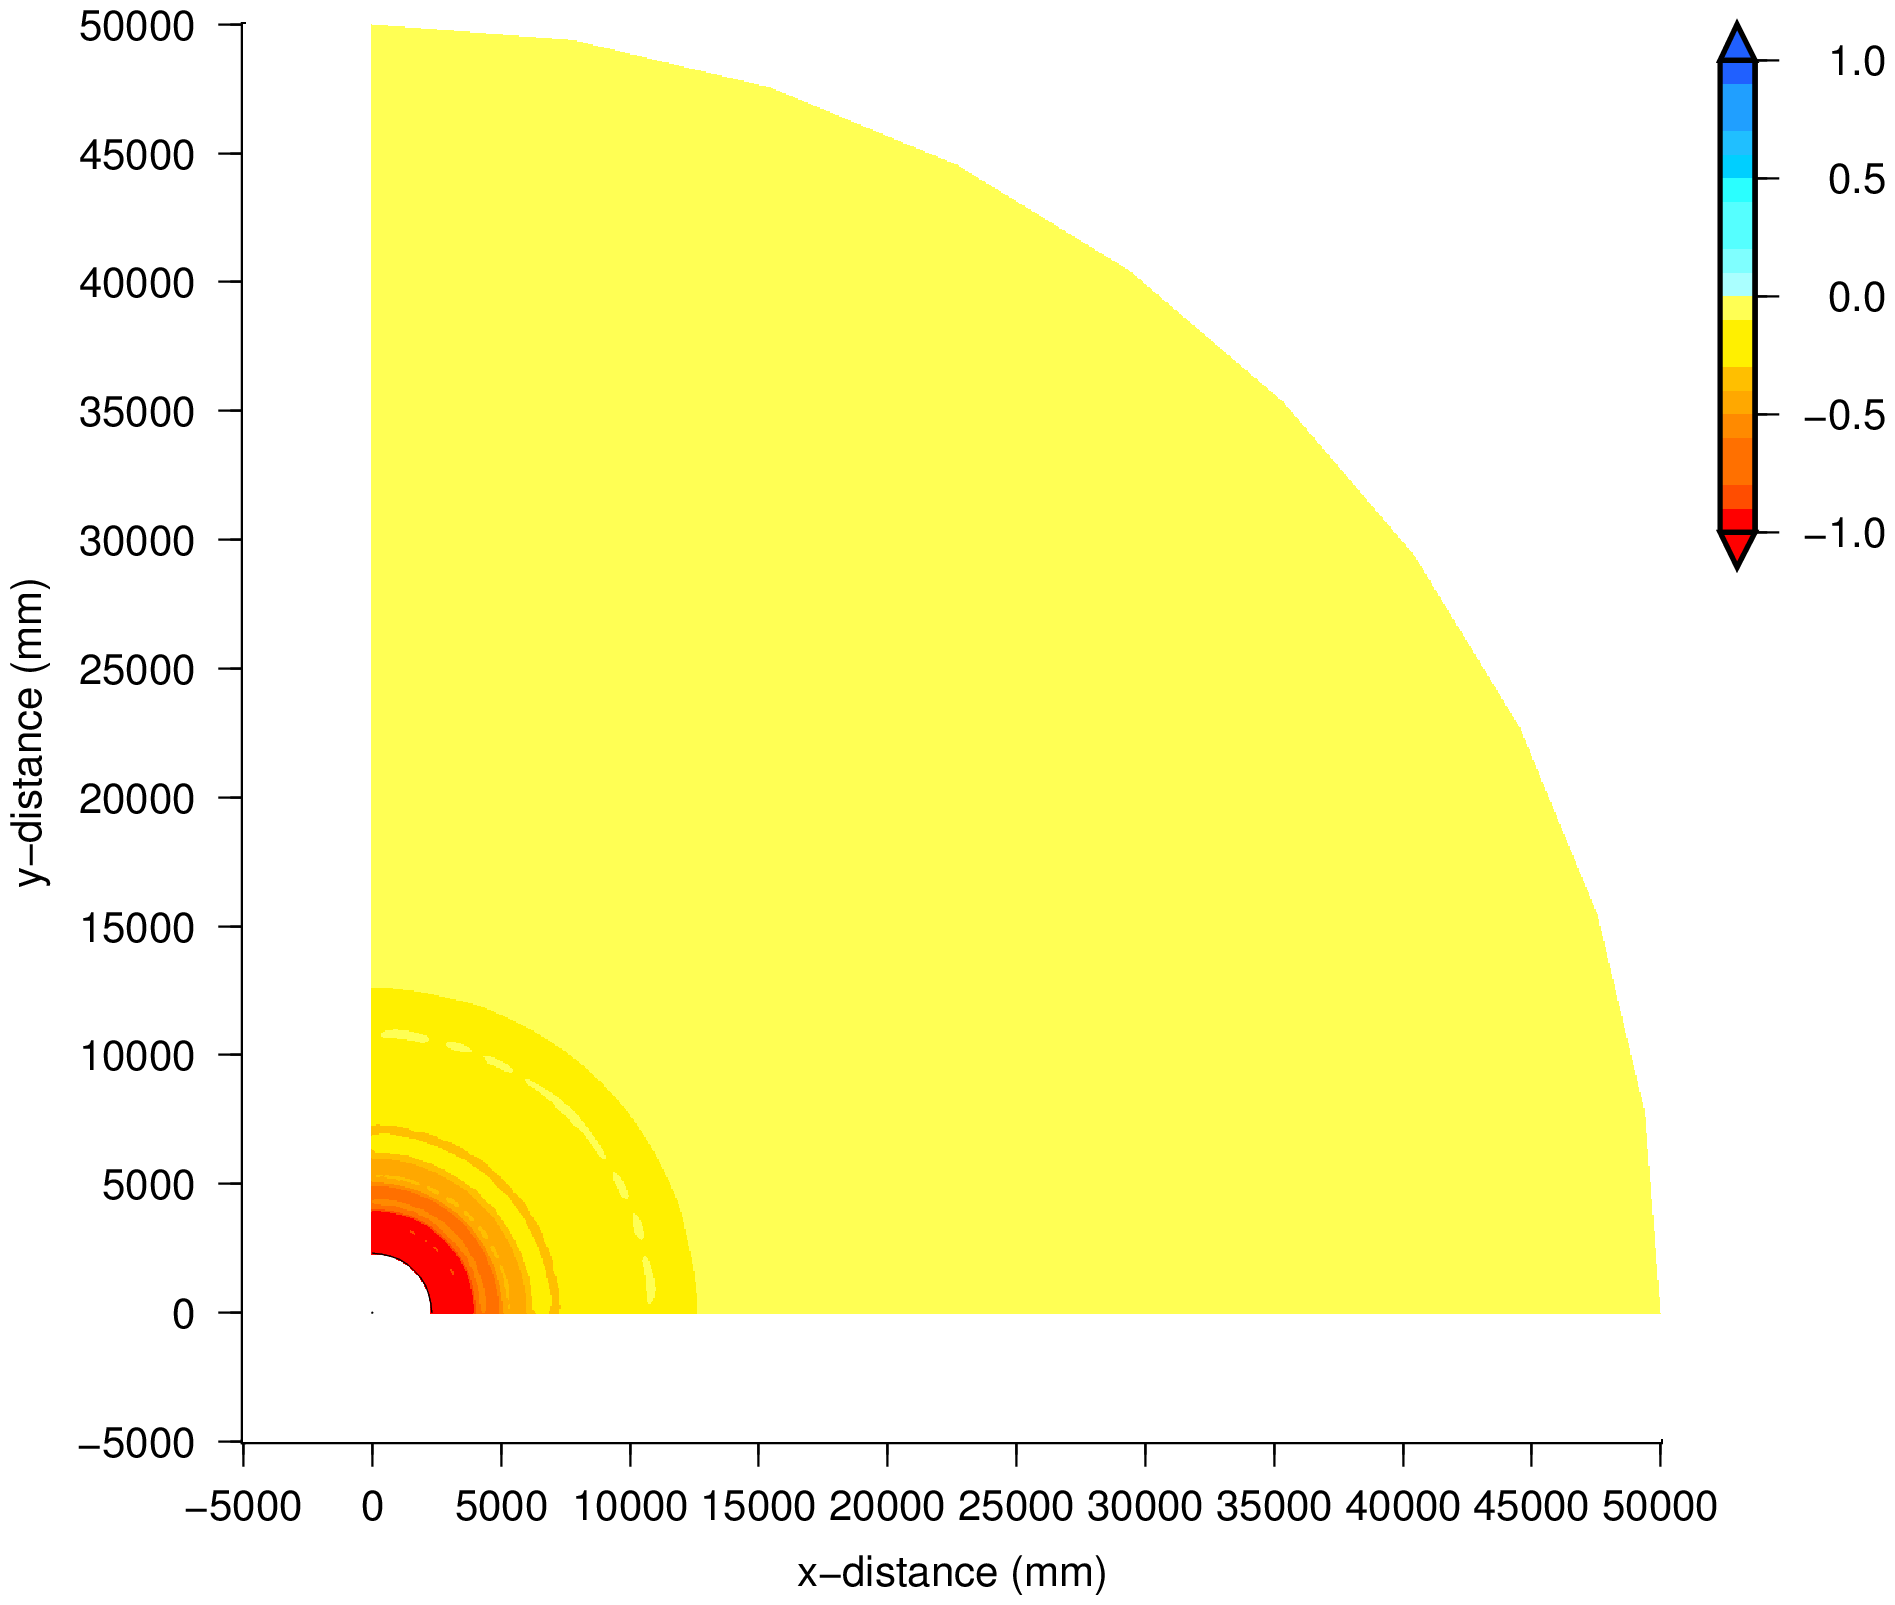
Example of principal stress distribution around embedded steel penstock
- An example of embedded steel penstock under internal water pressure is shown in this section.
- Backfill concrete with 1m thickness is treating this as a no-tension material.
- The first principal stresses of the concrete elements are small value, and no-tension state of backfill concrete is realized in this analysis.
- The tensile stress of steel penstock is about 400 MPa. On the other hand, the stresses of backfill concrete and base rock are about 1% or less of the stress of steel penstock.
- For this reason, unforeseen result is obtained when contour map is made using 'surface' command of GMT.
- Therefore, the stress of steel penstock part is not referred for contour map creation.
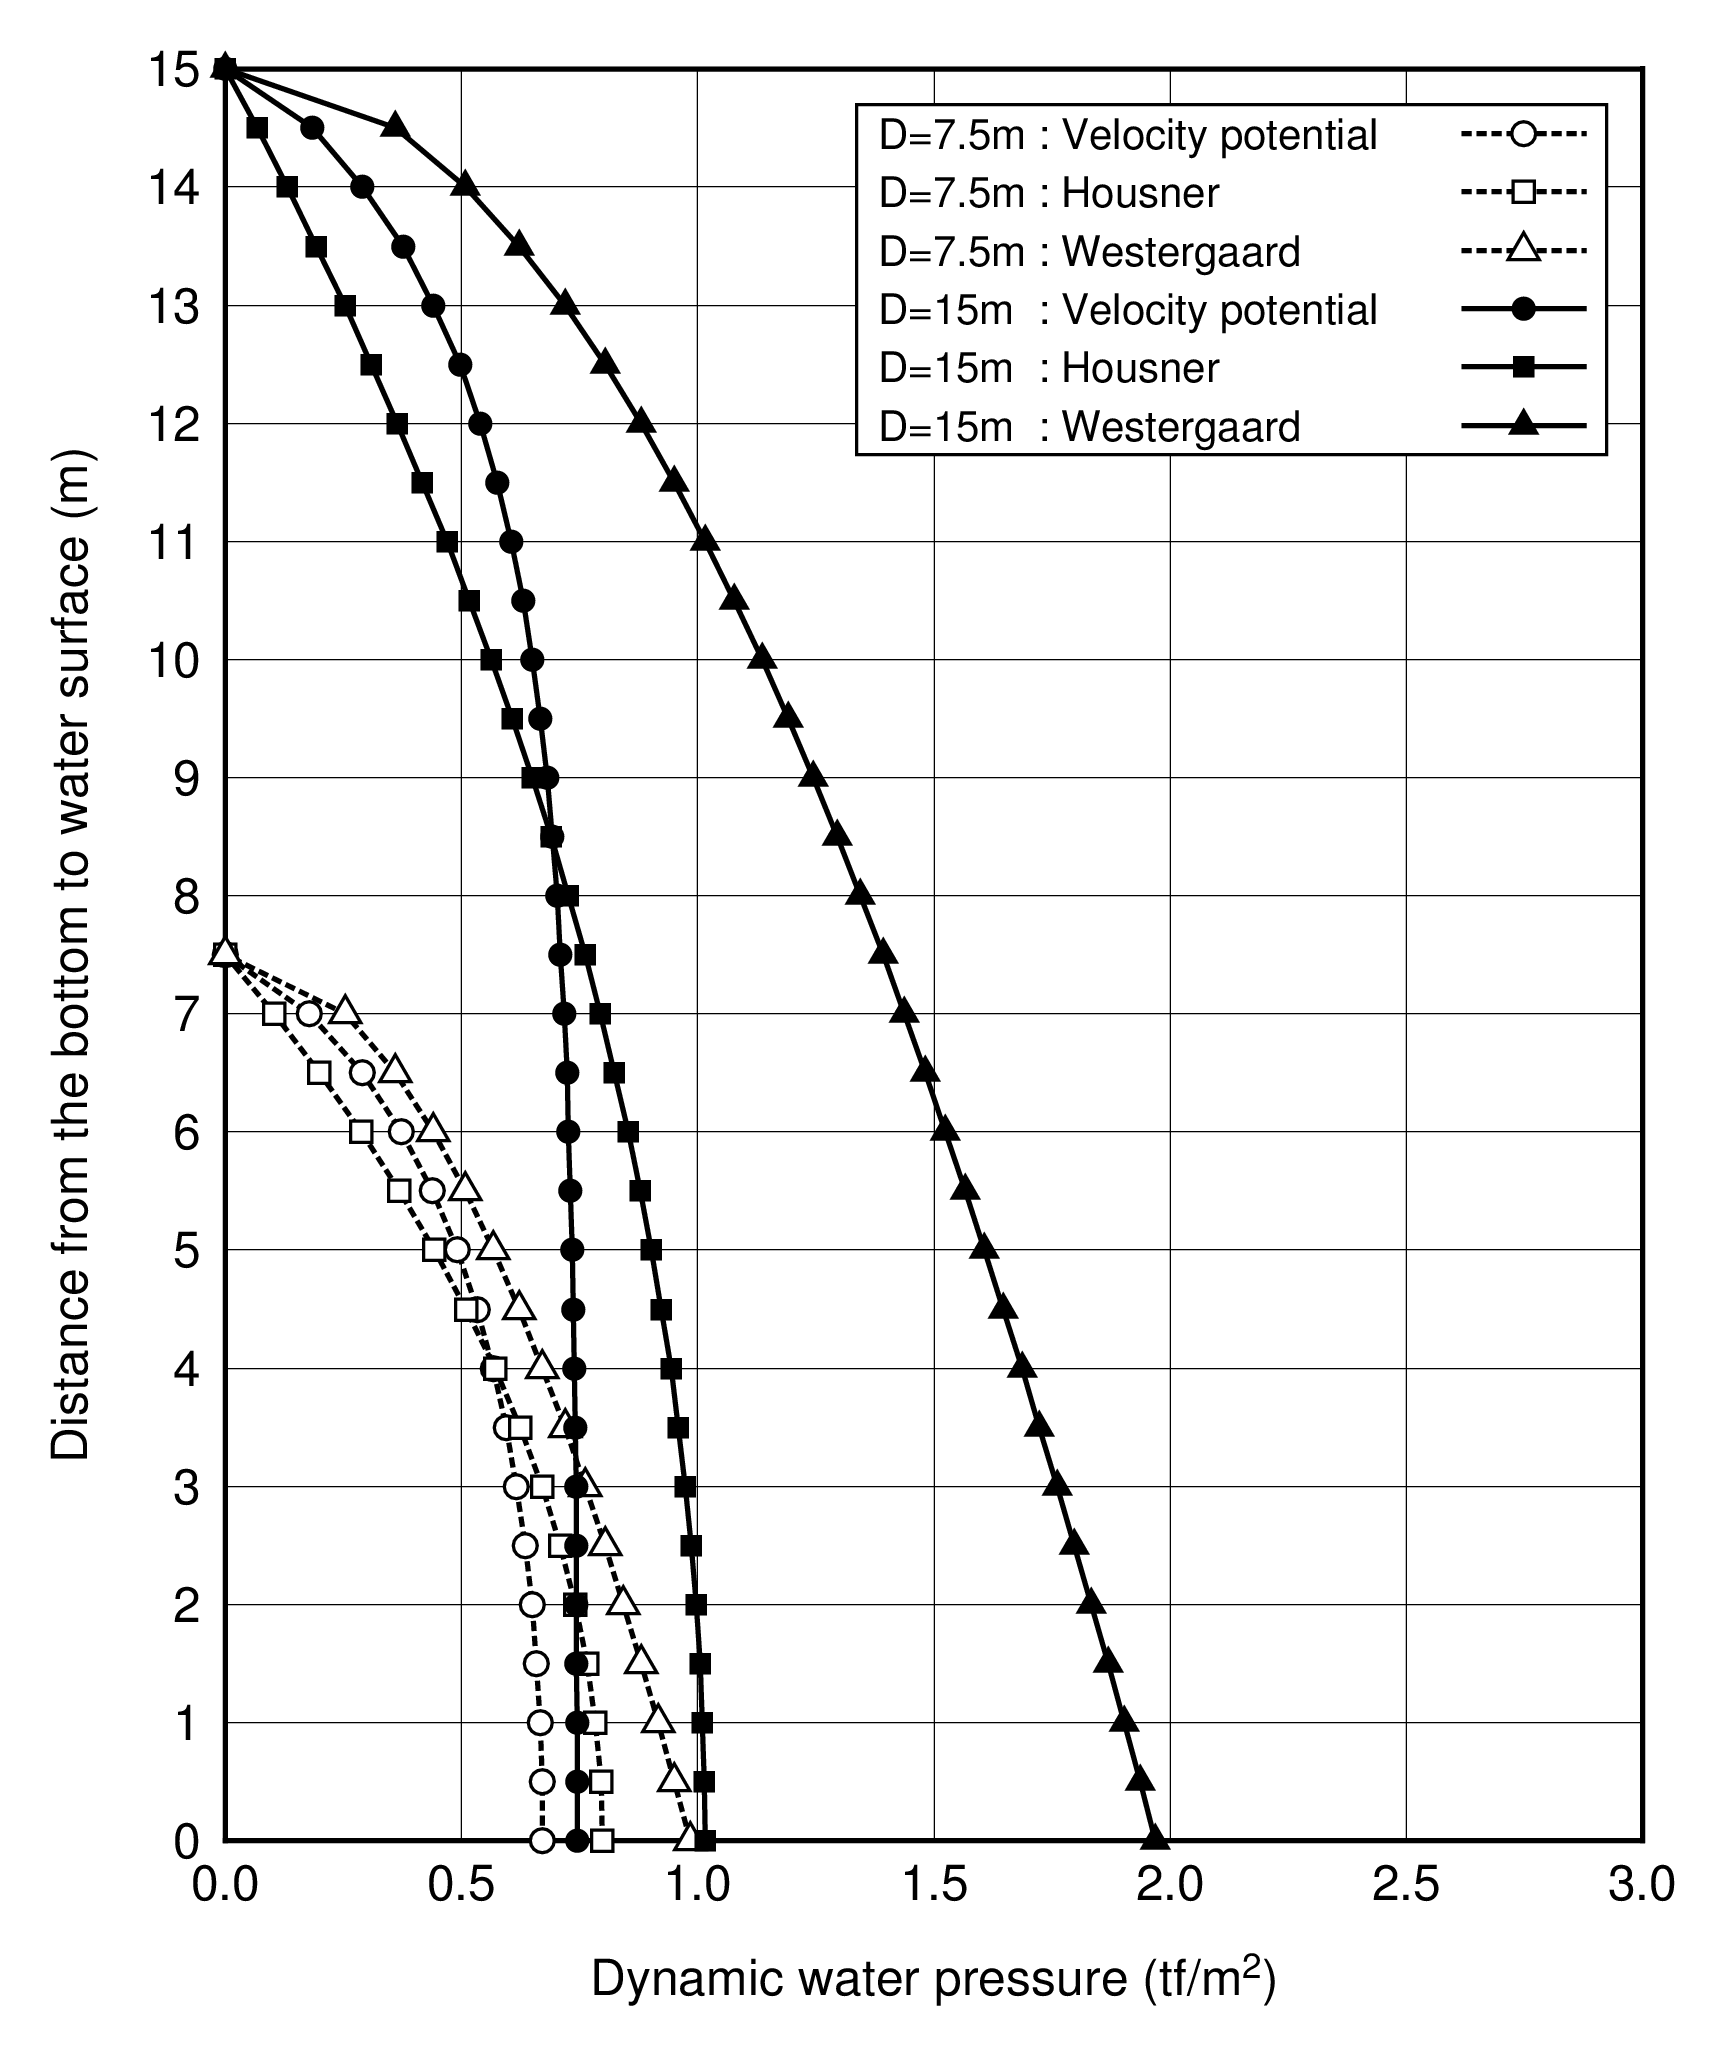
Drawing 2D plot with legend
Outline
- This is a program to make batch file for drawing 2D plot with legend.
- Location of legend area can be changeable like gnuplot.
- 4 Line types and 4 symbols in legend can be useful.
Batch file for execution of f90 program is shown below.
gfortran -o f90_GMTgra.exe f90_GMTgra.f90
f90_GMTgra inp_form.txt bat_test.bat
f90 program code for reading control data is shown below.
call getarg(1,fnameR) !input filename for control
call getarg(2,fnameW) !output filename (batch filename for GMT execution)

open(11,file=fnameR,status='old')
read(11,'(a)') fnameF  !output image filename (eps)
read(11,'(a)') xlabel  !label of x-axis
read(11,'(a)') ylabel  !label of y-axis
read(11,'(a)') range   !range of x-axis/range of y-axis
read(11,'(a)') scale   !length of x-axis/length of y-axis
read(11,'(a)') xga     !grid interval and tickmark for x-axis
read(11,'(a)') yga     !grid interval and tickmark for y-axis
read(11,*) nplot,dplot !number of plot data, size of symbol
allocate(fn(1:nplot),sxp(1:nplot),syp(1:nplot),sleg(1:nplot))
allocate(nline(1:nplot),nsymb(1:nplot))
do i=1,nplot
    !data filename, column for x, column for y, line type, symbol, title
    read(11,*) fn(i),sxp(i),syp(i),nline(i),nsymb(i),sleg(i)
end do
read(11,*) strP,dx,dy   !location of legend, distance from x-axis, distance from y-axis
read(11,*) ipt,scl,llen !font size, font w/h, line length (number of characters)
close(11)
| Line type (nline) | Symbol (nsymb) |
|---|
| 0 | none | 0 | none | | |
| 1 | solid line | 10 | circle | 11 | black circle |
| 2 | dash line | 20 | square | 21 | black square |
| 3 | long and short dash line | 30 | triangle | 31 | black triangle |
| 4 | broken line | 40 | diamond | 41 | black diamond |
| Location of legend in the graph (strP) |
|---|
| "bl" | bottom left (in graph area) |
| "br" | bottom right (in graph area) |
| "tr" | top right (in graph area) |
| "tl" | top left (in graph area) |
| "ot" | top right (out of graph area) |
| "or" | bottom right (out of graph area) |
- dx, dy
- : distance from x-axis and y-axis to out line of legend area
- ipt
- : Font size (pt)
- scl
- : ratio of width and height of 1 font (width/height)
- llen
- : length of line in number of characters
Programs and drawings
Source code by f90
Samples