Outline of this page
Following items are shown in this page.
- The Cunnane formula is used as a plotting position formula for an observed value plot.
- Same input datas as the page of 'f90 HFA (hydrologic frequency analisys)' are used for the drawings in this page. (Rainfall data in Sapporo, Maebashi and Kyoto)
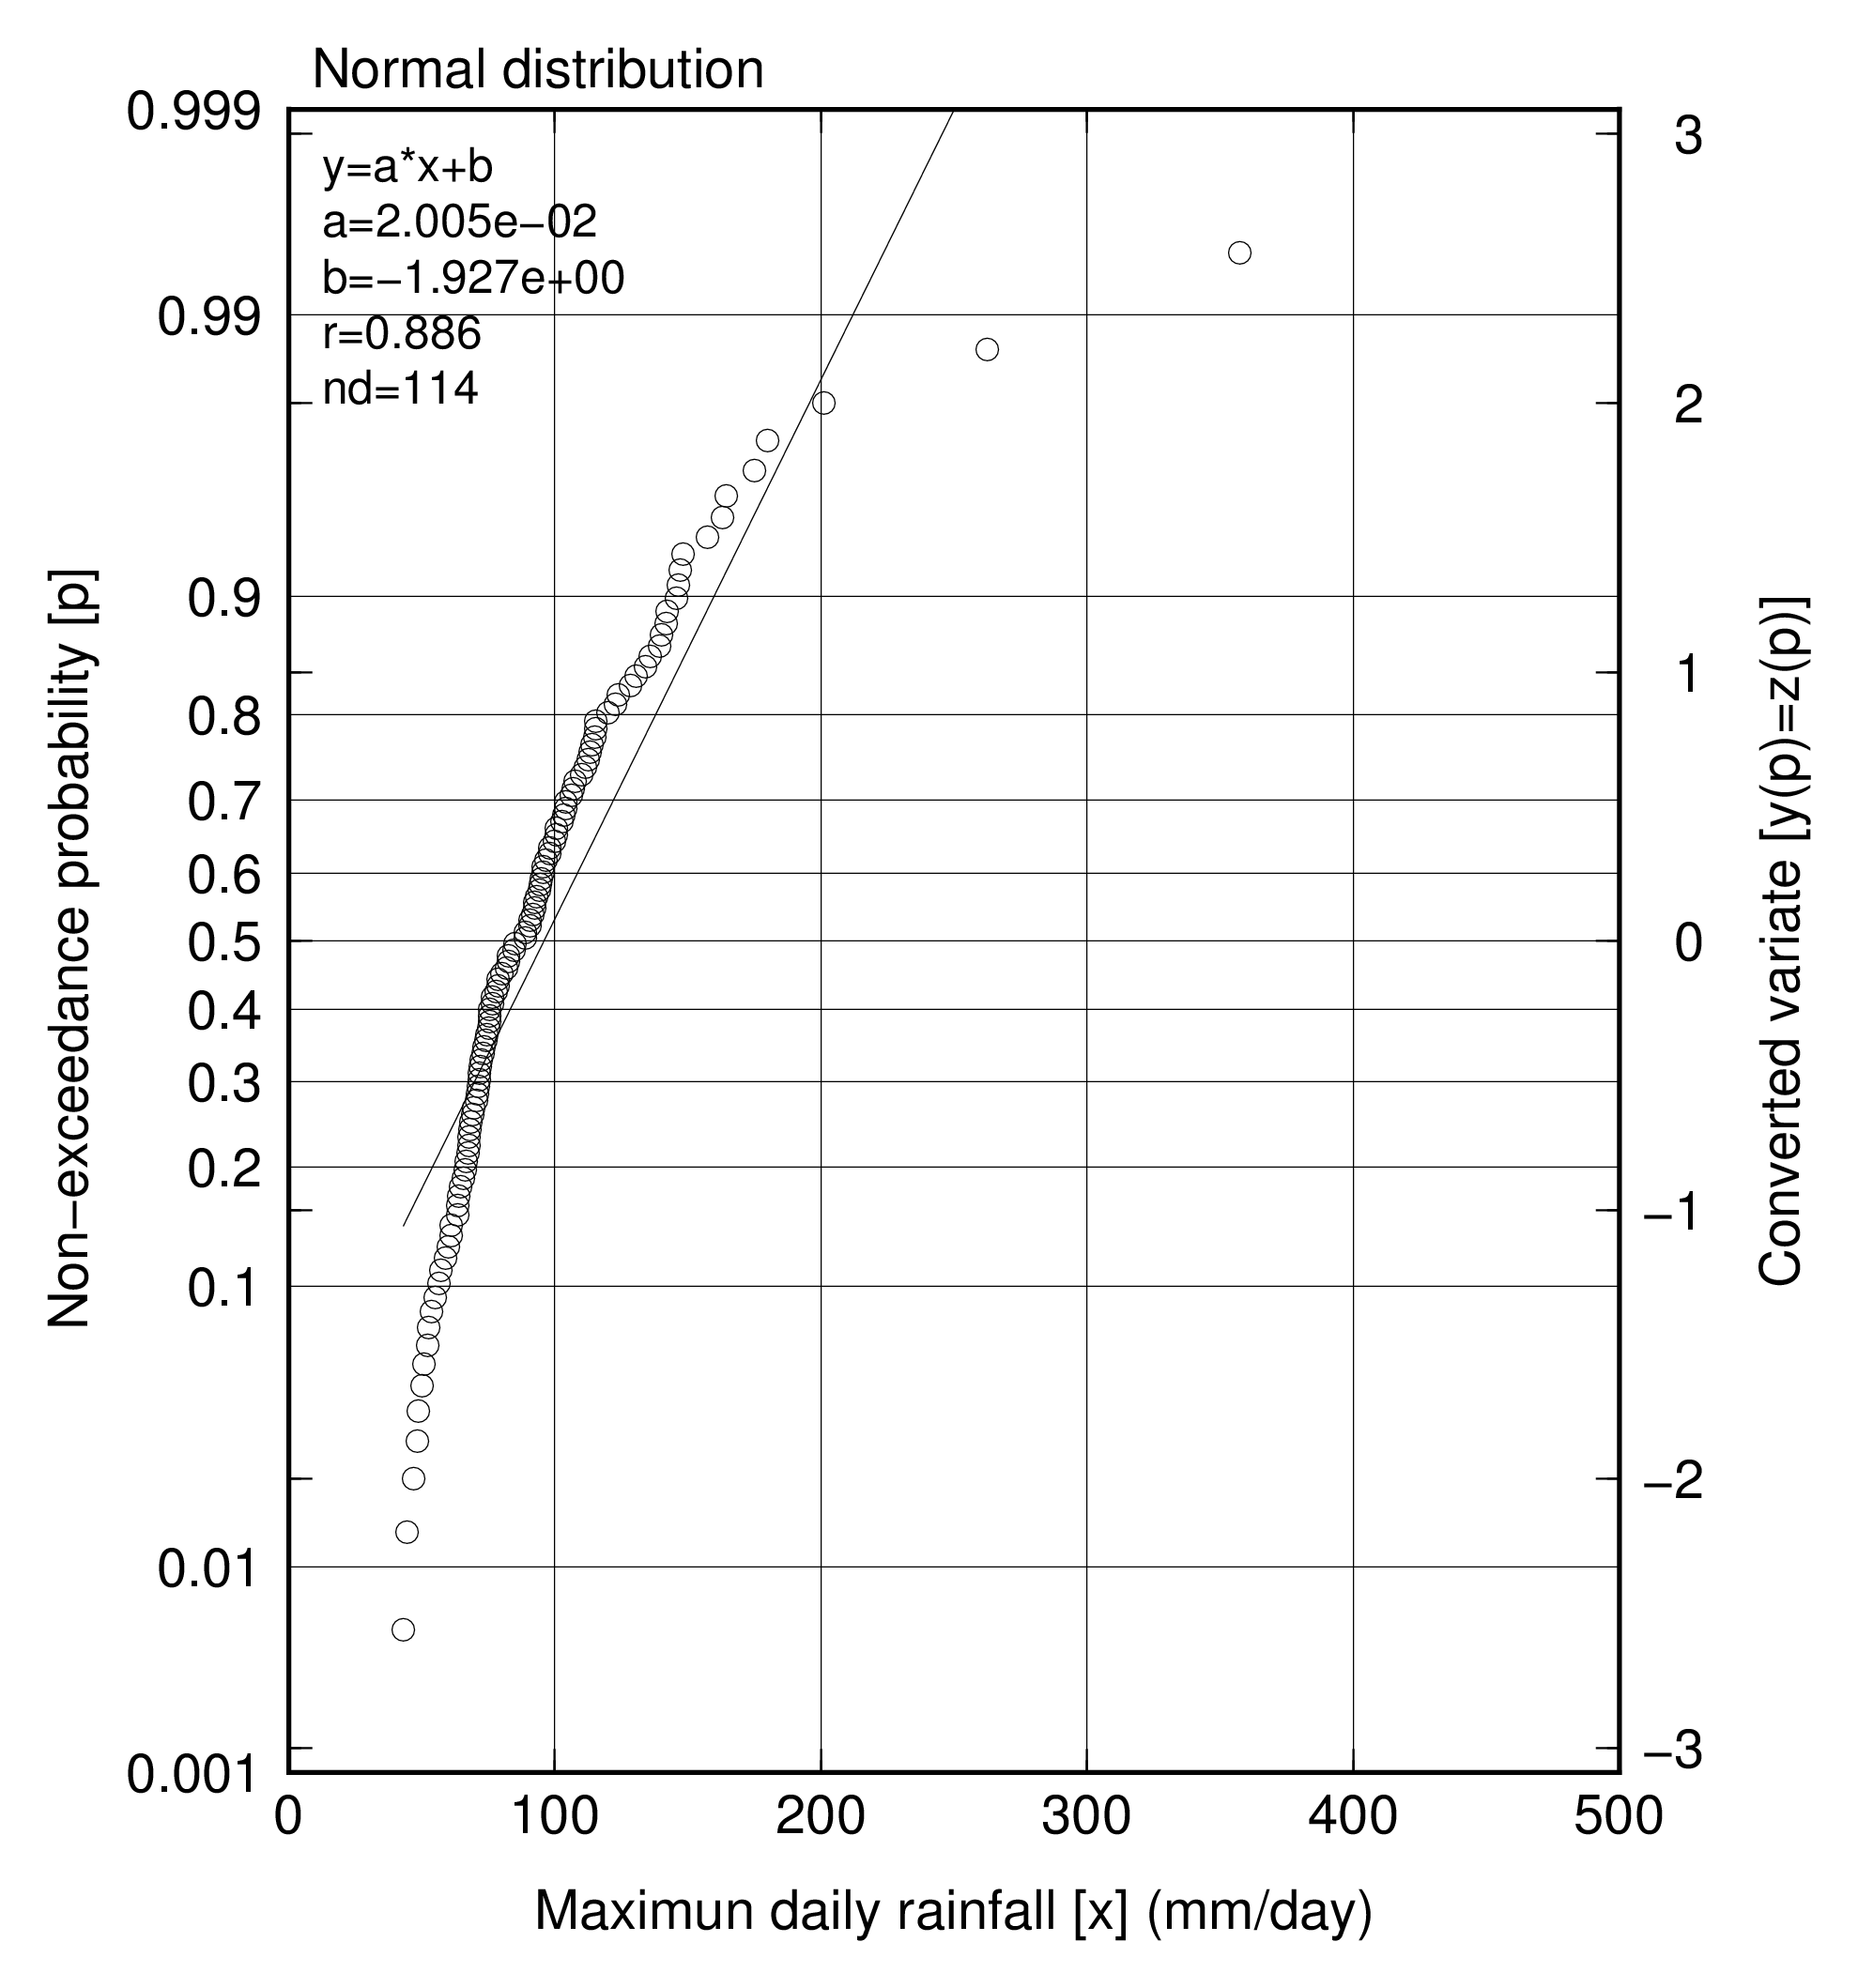
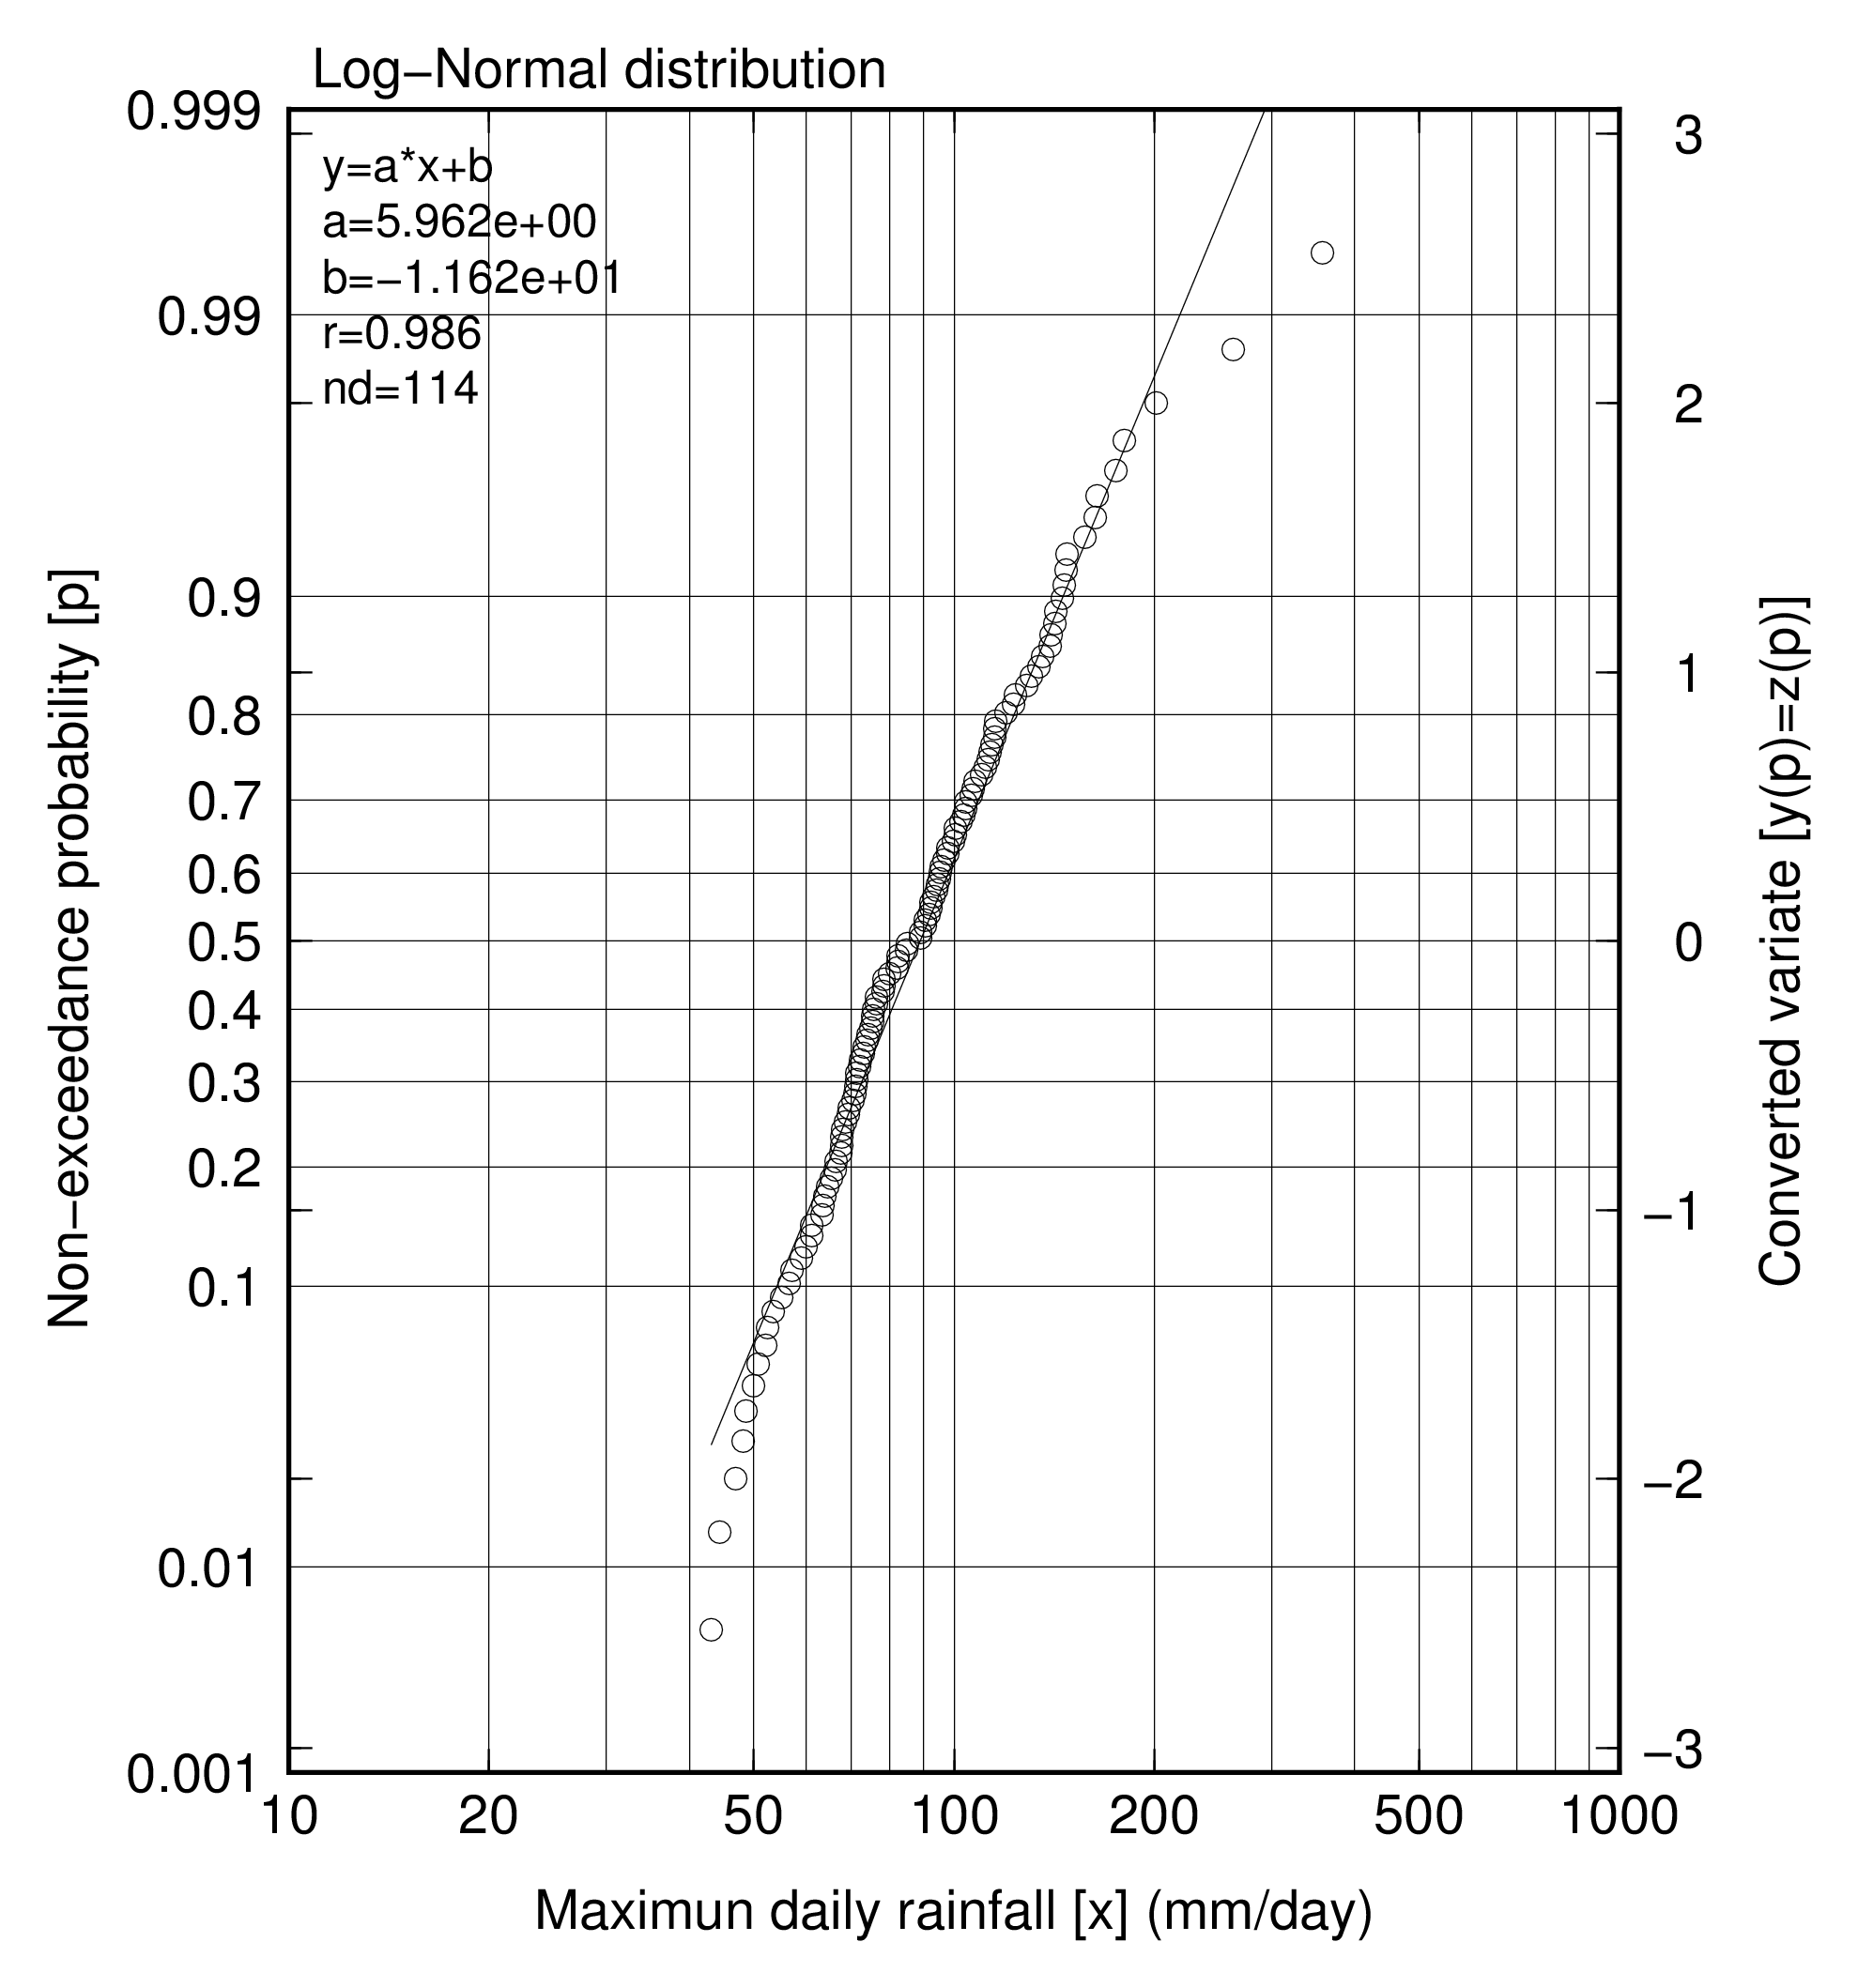
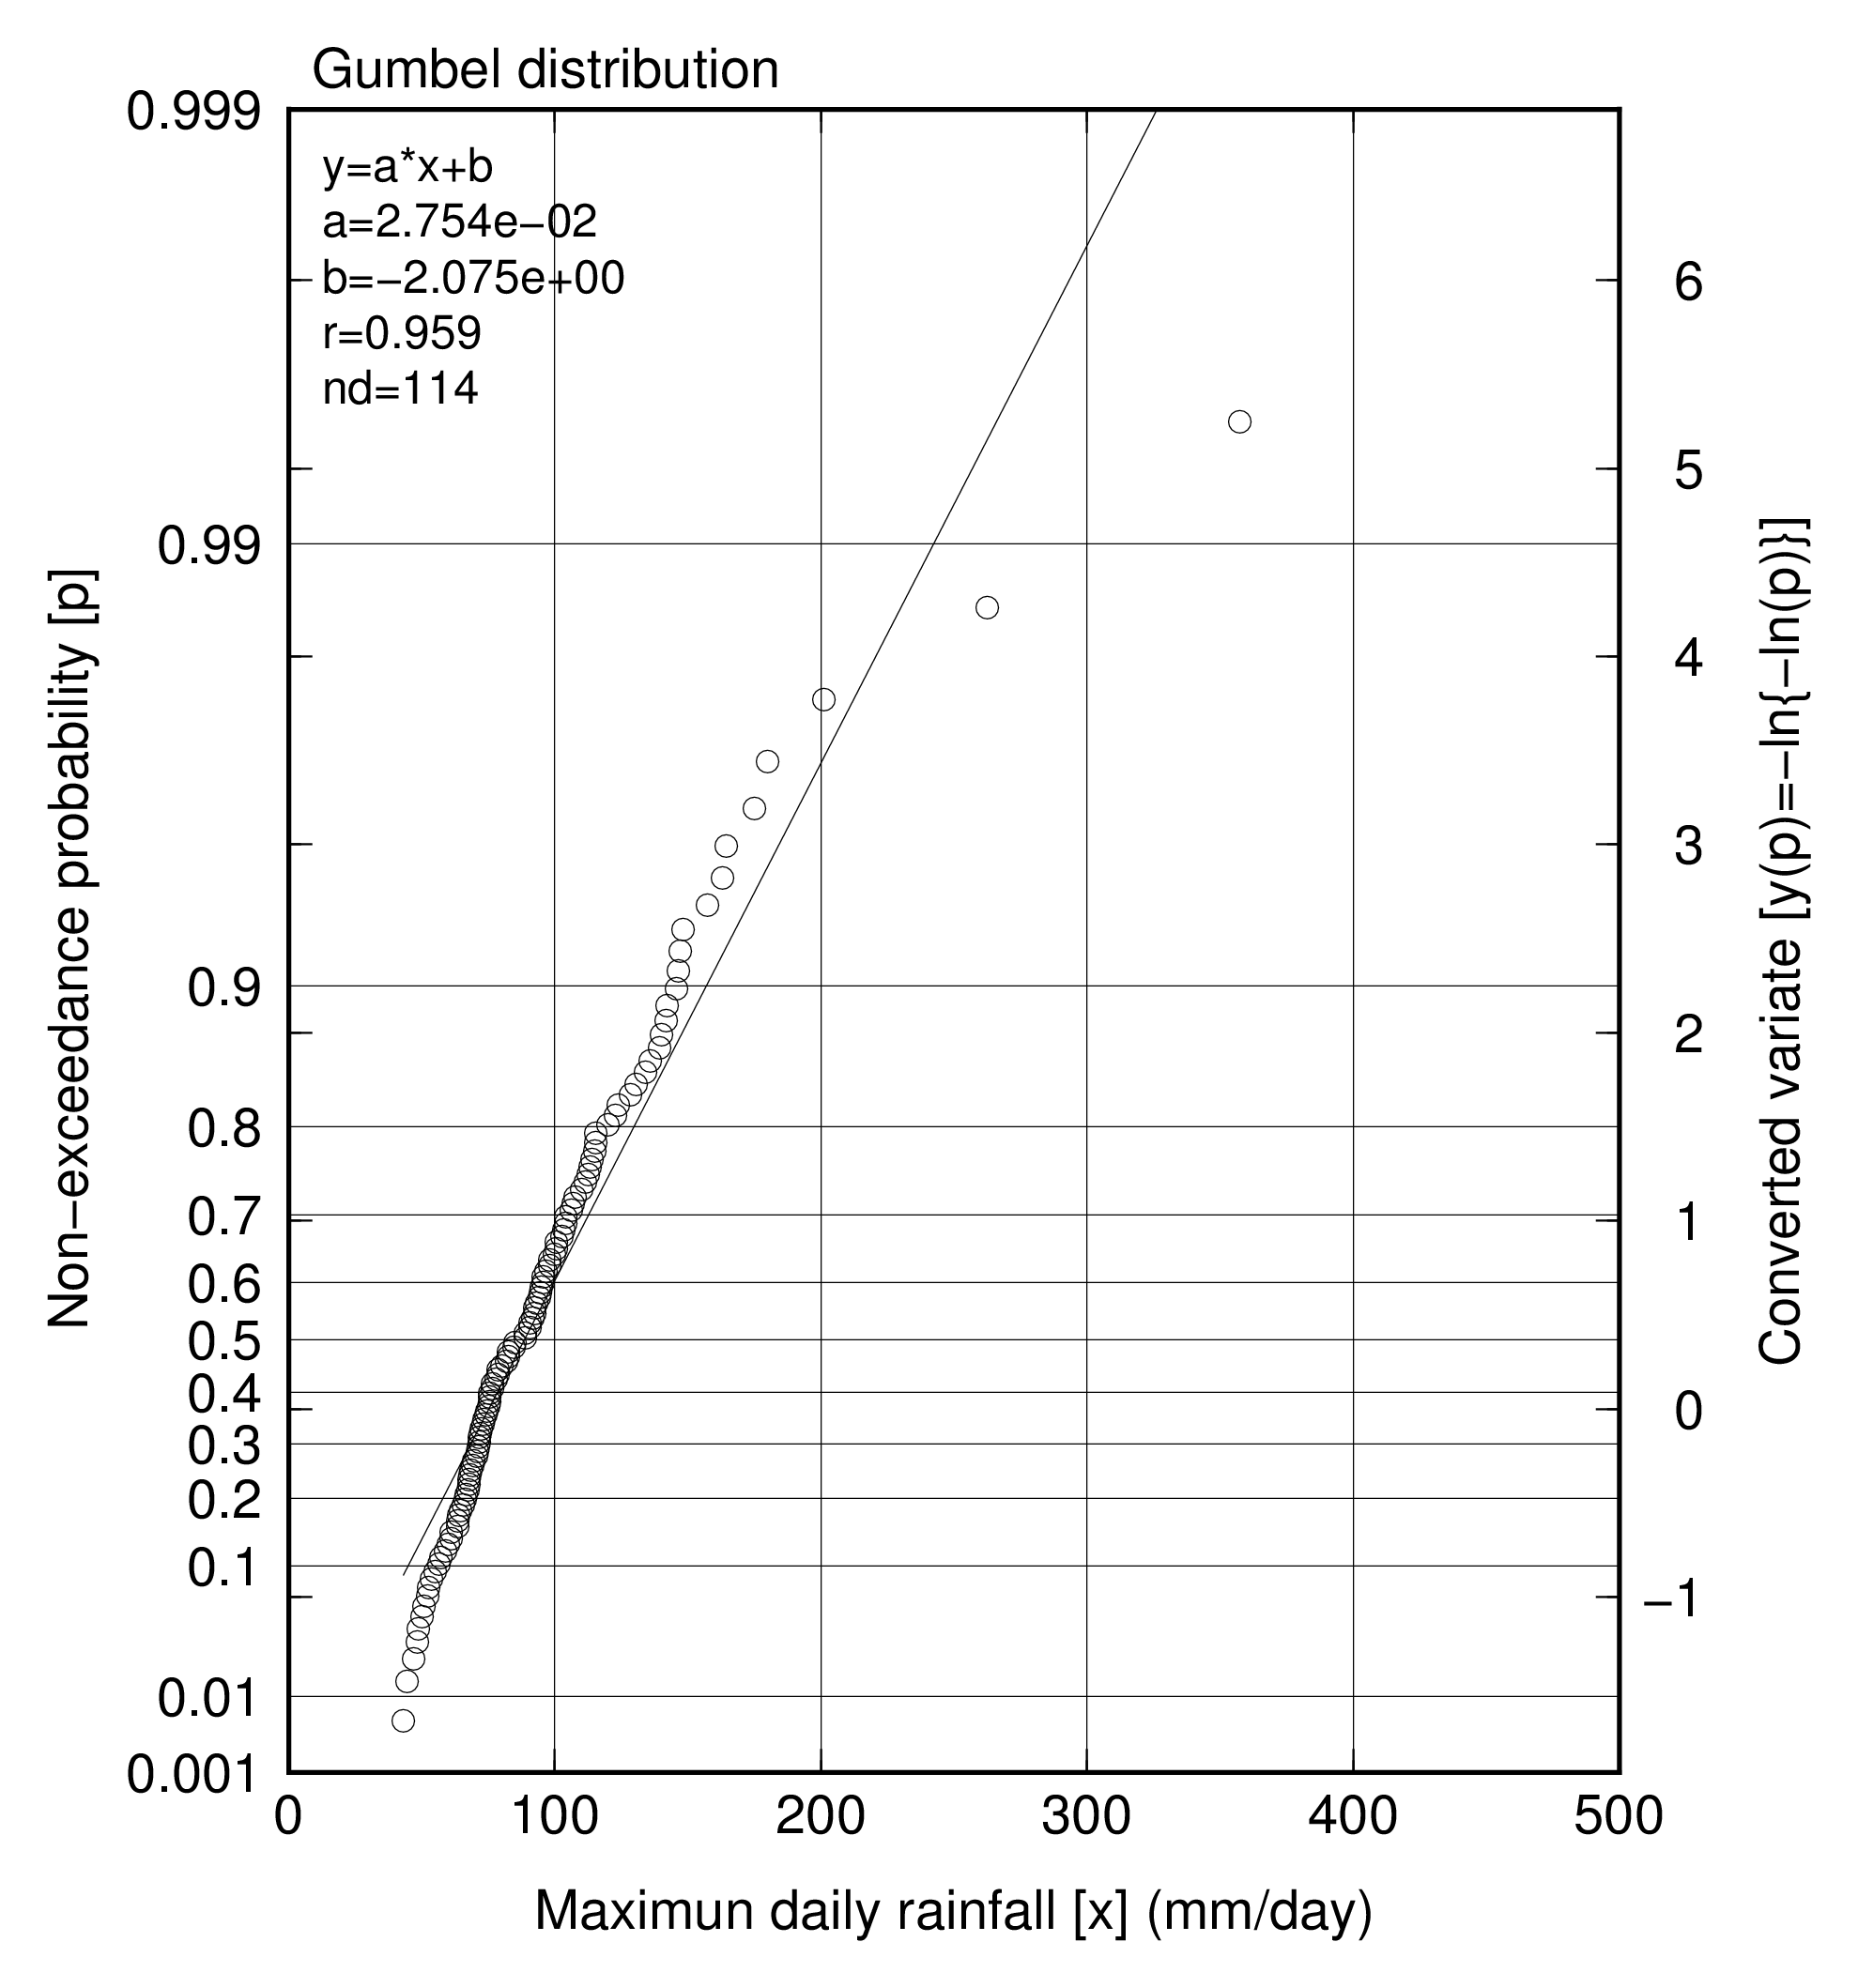
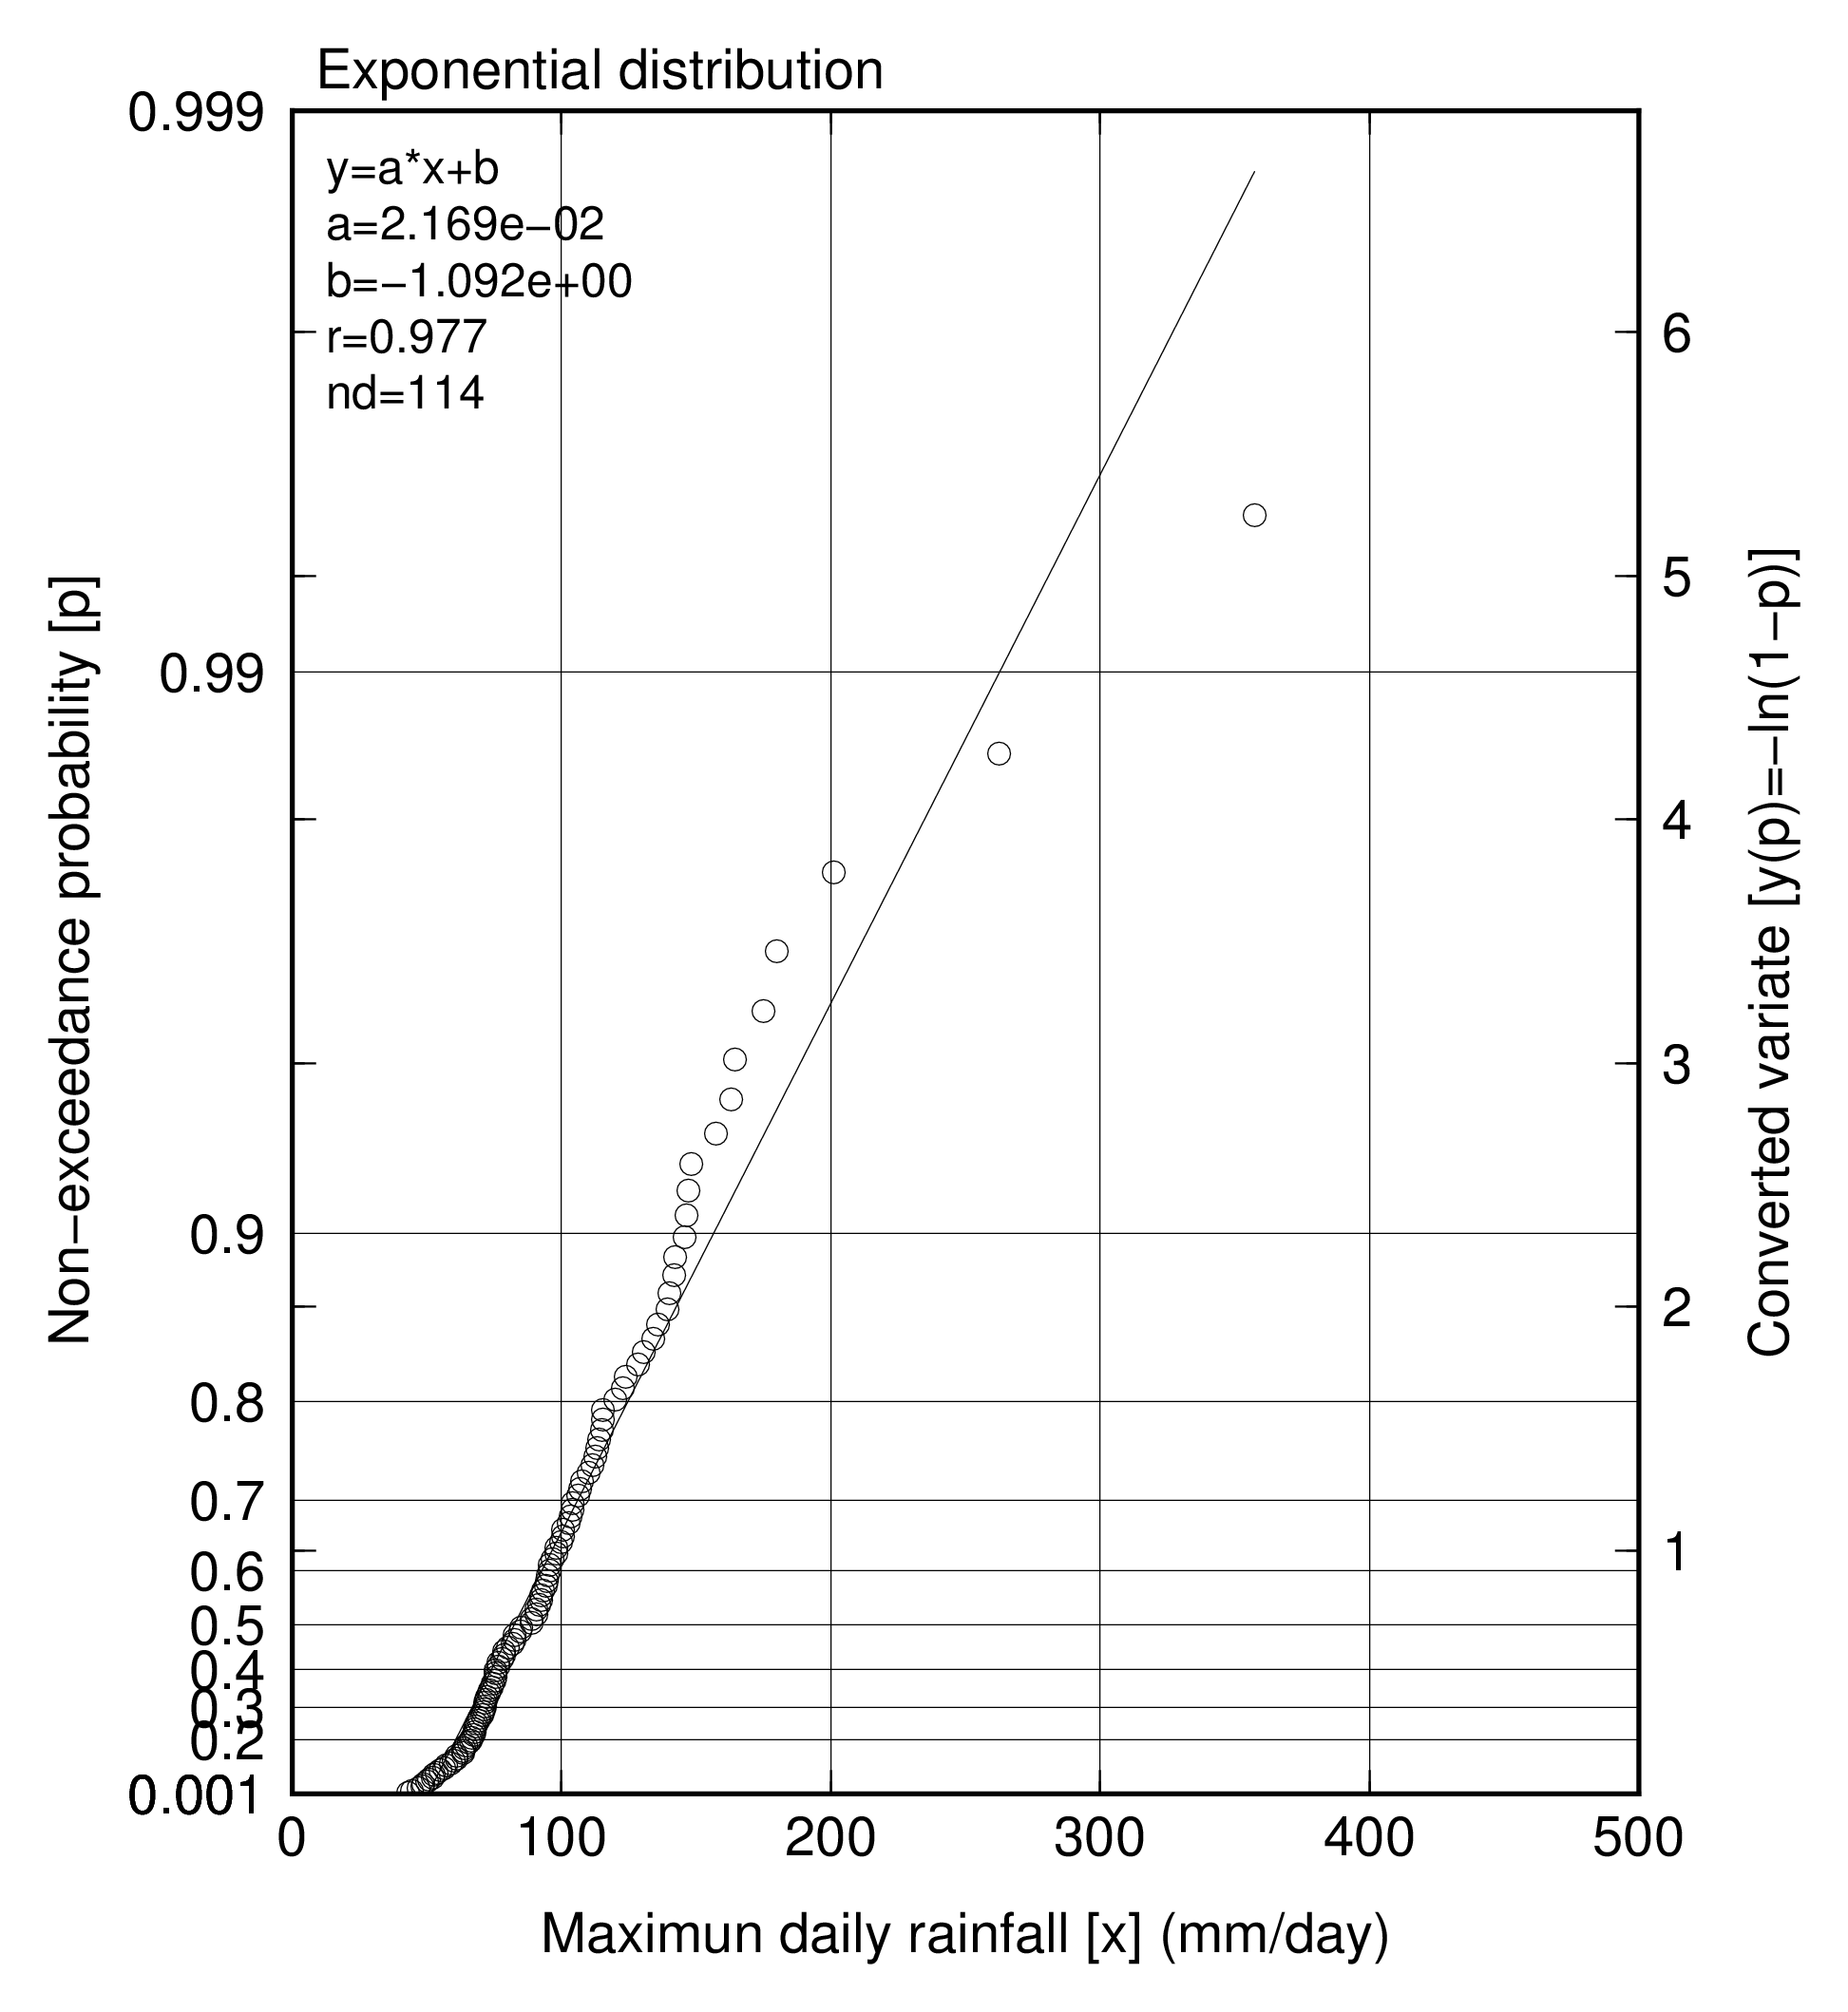
- Y-values of each observed data are defined as velues which have the linear relationship between X-values and Y-values. Conversion method of Y-value is shown below for each probability paper.
| Name of paper | Quantile | Conversion | Value of Y-axis | Value of X-axis |
|---|---|---|---|---|
| Normal probability paper | xp=μ+σ*zp | (xp-μ)/σ=zp | Y=zp | X=xp |
| Log-Normal probability paper | ln(xp)=μ'+σ'*zp | {ln(xp)-μ'}/σ'=zp | Y=zp | X=log(xp) |
| Gumbel probability paper | xp=c-a*ln{-ln(p)} | (xp-c)/a=-ln{-ln(p)} | Y=-ln{-ln(p)} | X=xp |
| Weibull probability paper | xp=c+a*{-ln(1-p)}1/k | k*ln{(xp-c)/a}=ln{-ln(1-p)} | Y=ln{-ln(1-p)} | X=log(xp) |
| Exponential probability paper | xp=c-a*ln(1-p) | (xp-c)/a=-ln(1-p) | Y=-ln(1-p) | X=xp |


