Outline of this page
Following items are shown in this page
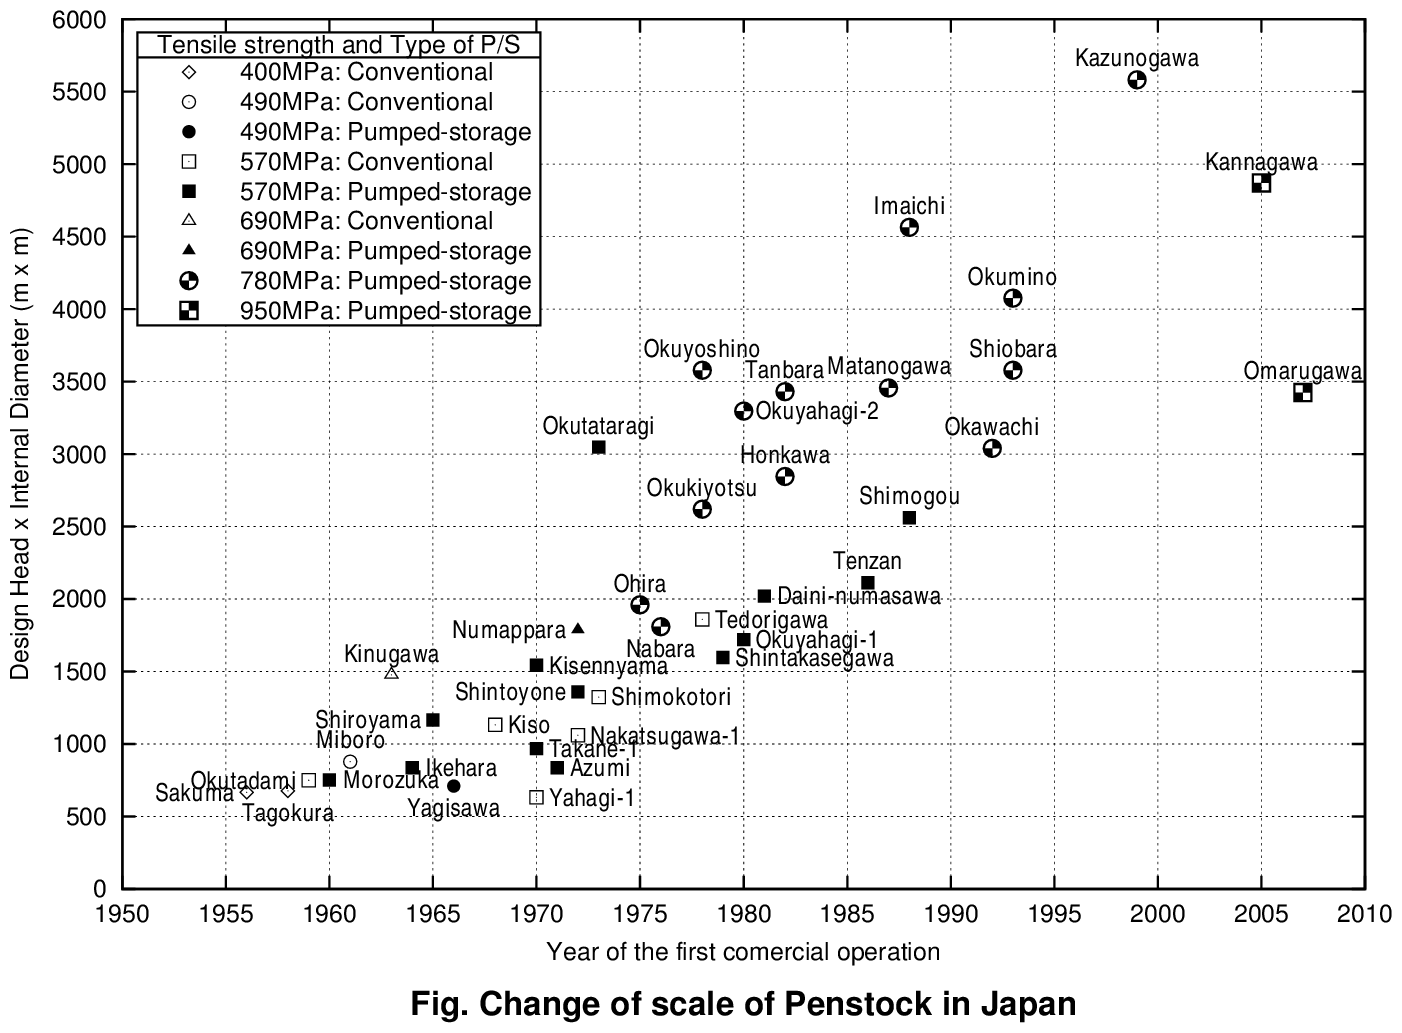
Change of scale of Steel penstock in Japan
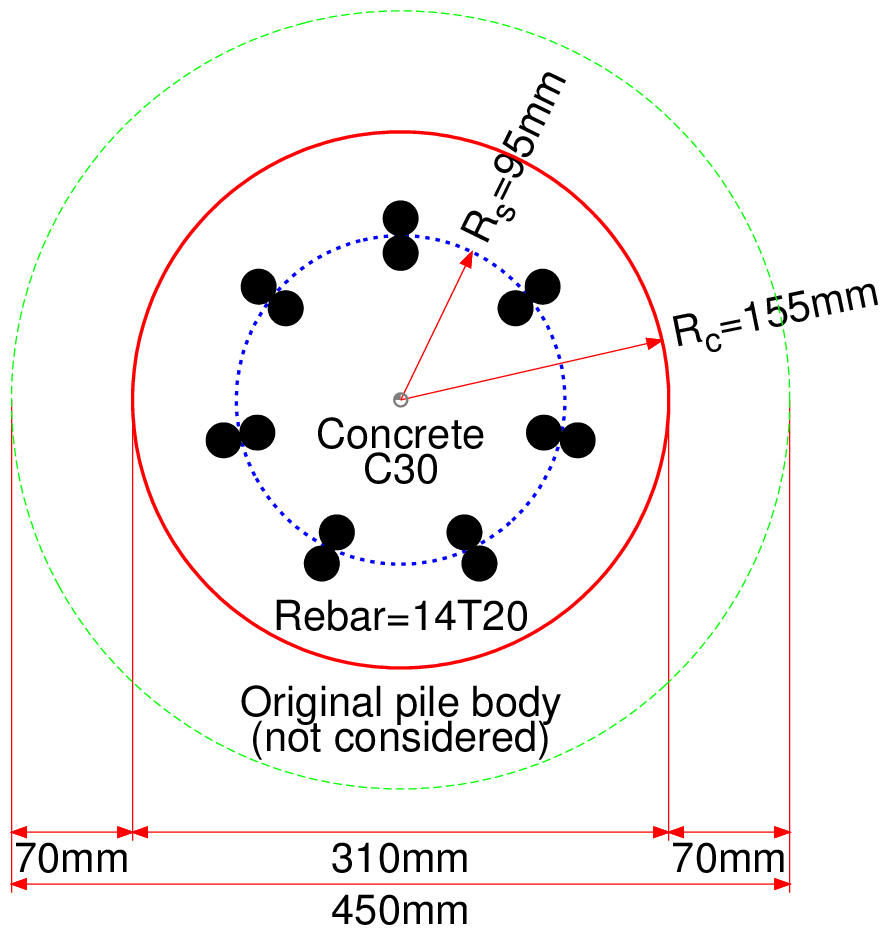
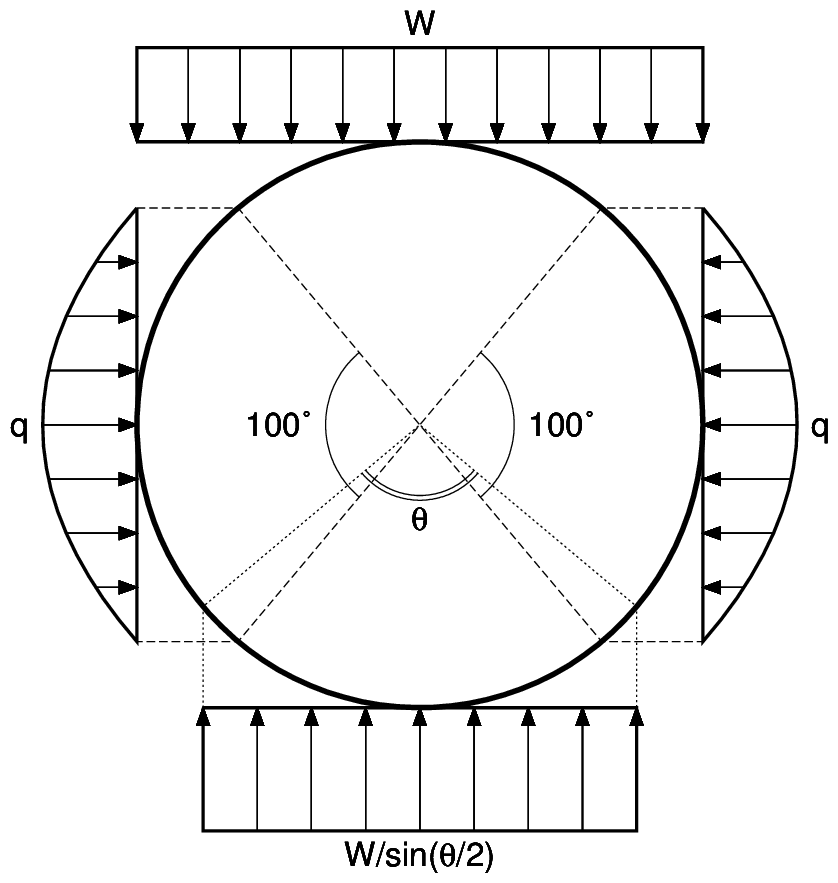
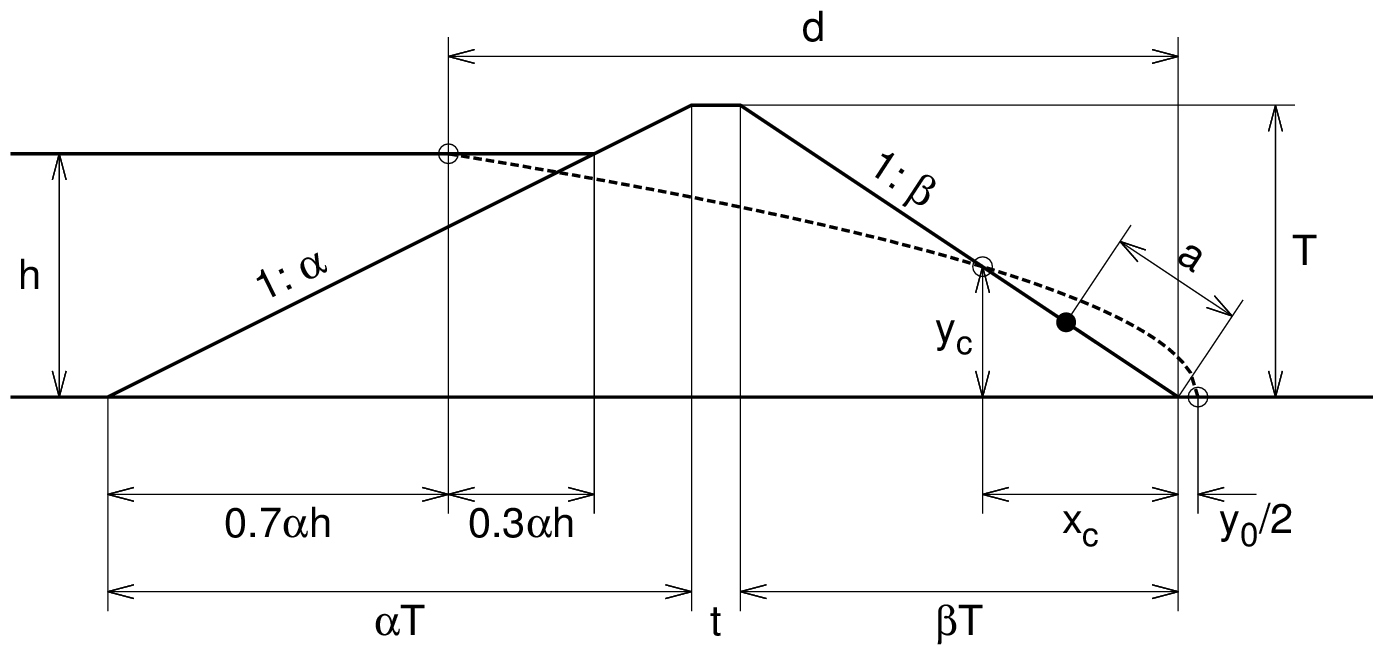
Samples of explanatory drawings
Batch file for execution of awk and gnuplot
Script for awk
Script for gnuplot
Figures by gnuplot
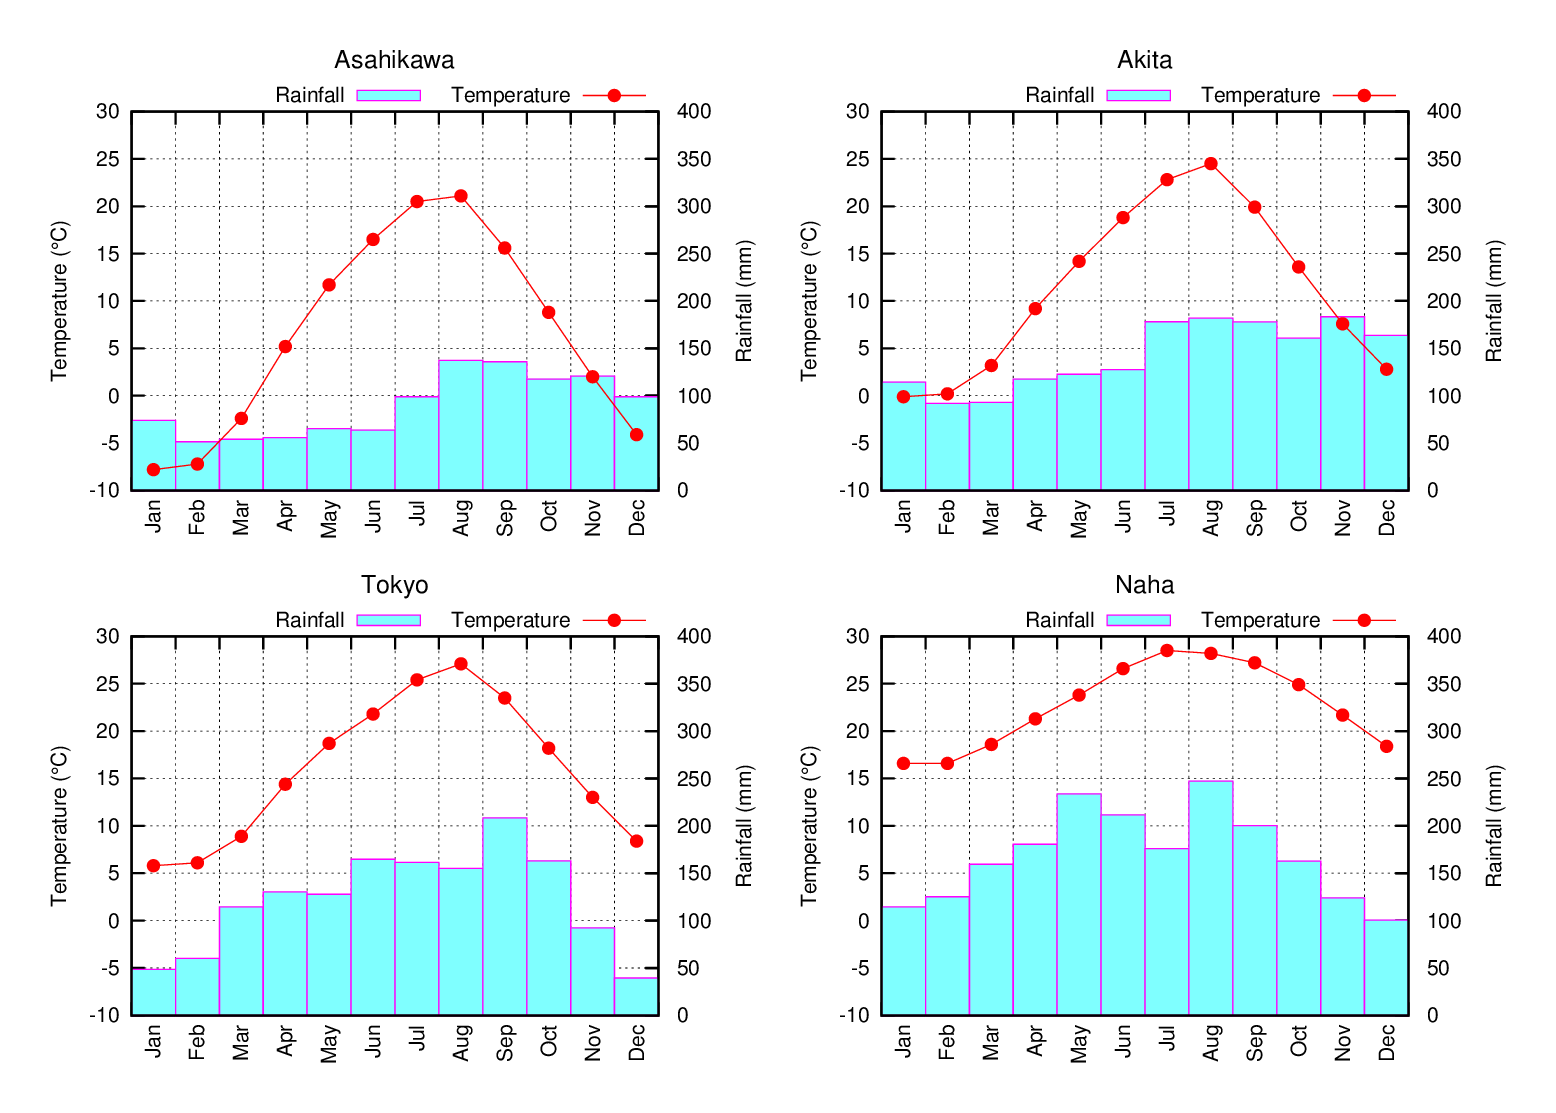
Comparison of climate (temperature and rainfall)
Outline
- The Temperatures and rainfalls of 4-cities in Japan are shown in the graphs.
- 4 graphs are included in 1 page of image. This image was created using the function multiplot layout of gnuplot.
- Input datas for 4-cities are quite same as them which are used in GMT drawing.
Script, data and figure by gnuplot
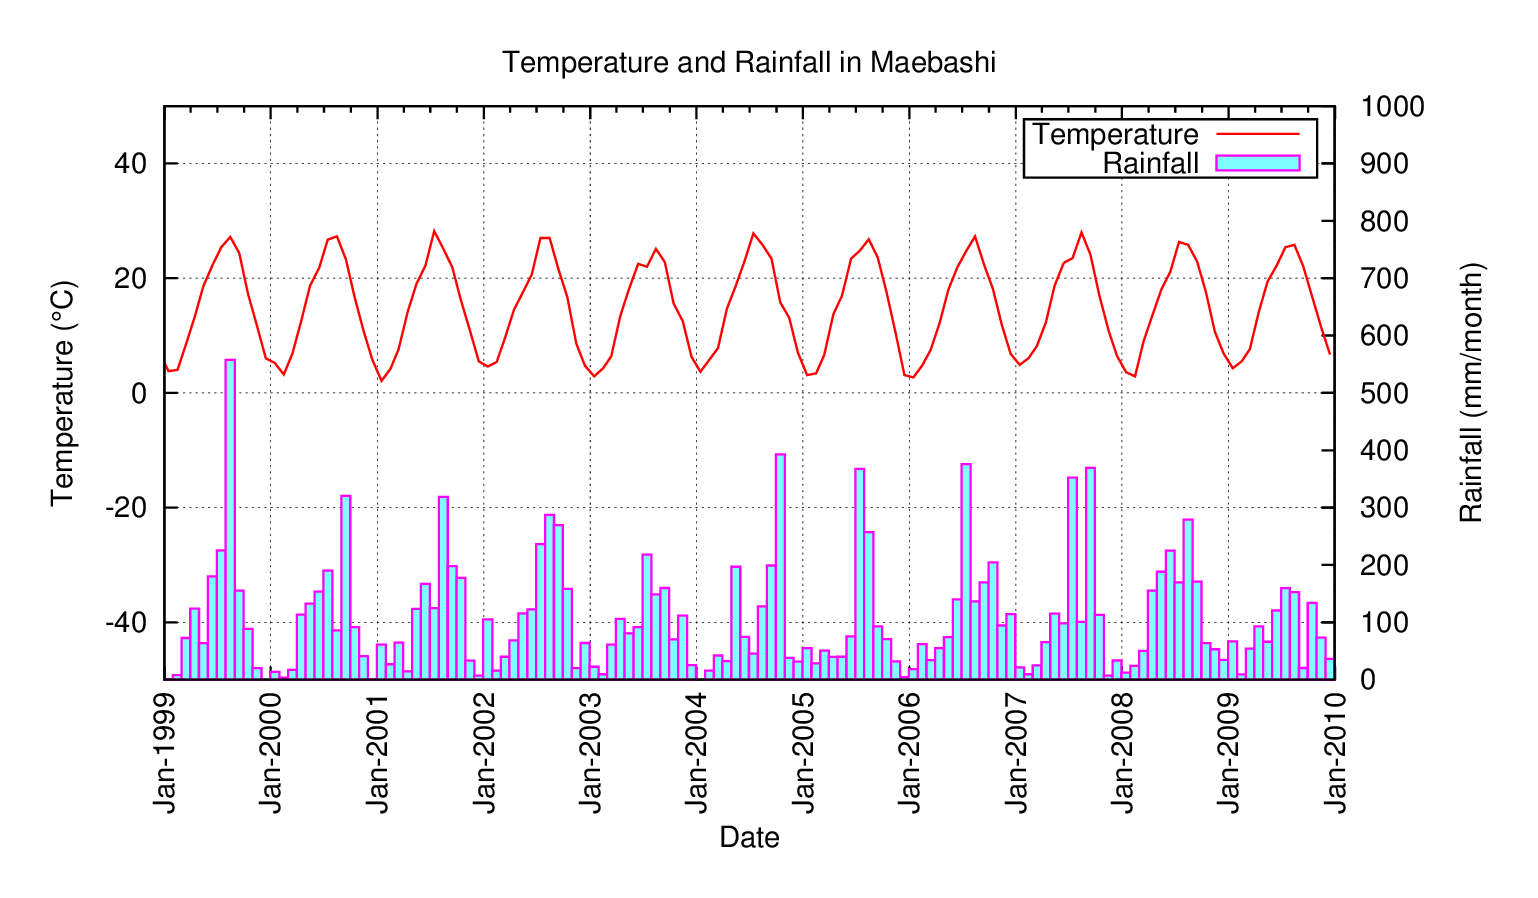
Time-sequence diagram (monthly variation of temperature and rainfall)
Script, data and figure by gnuplot
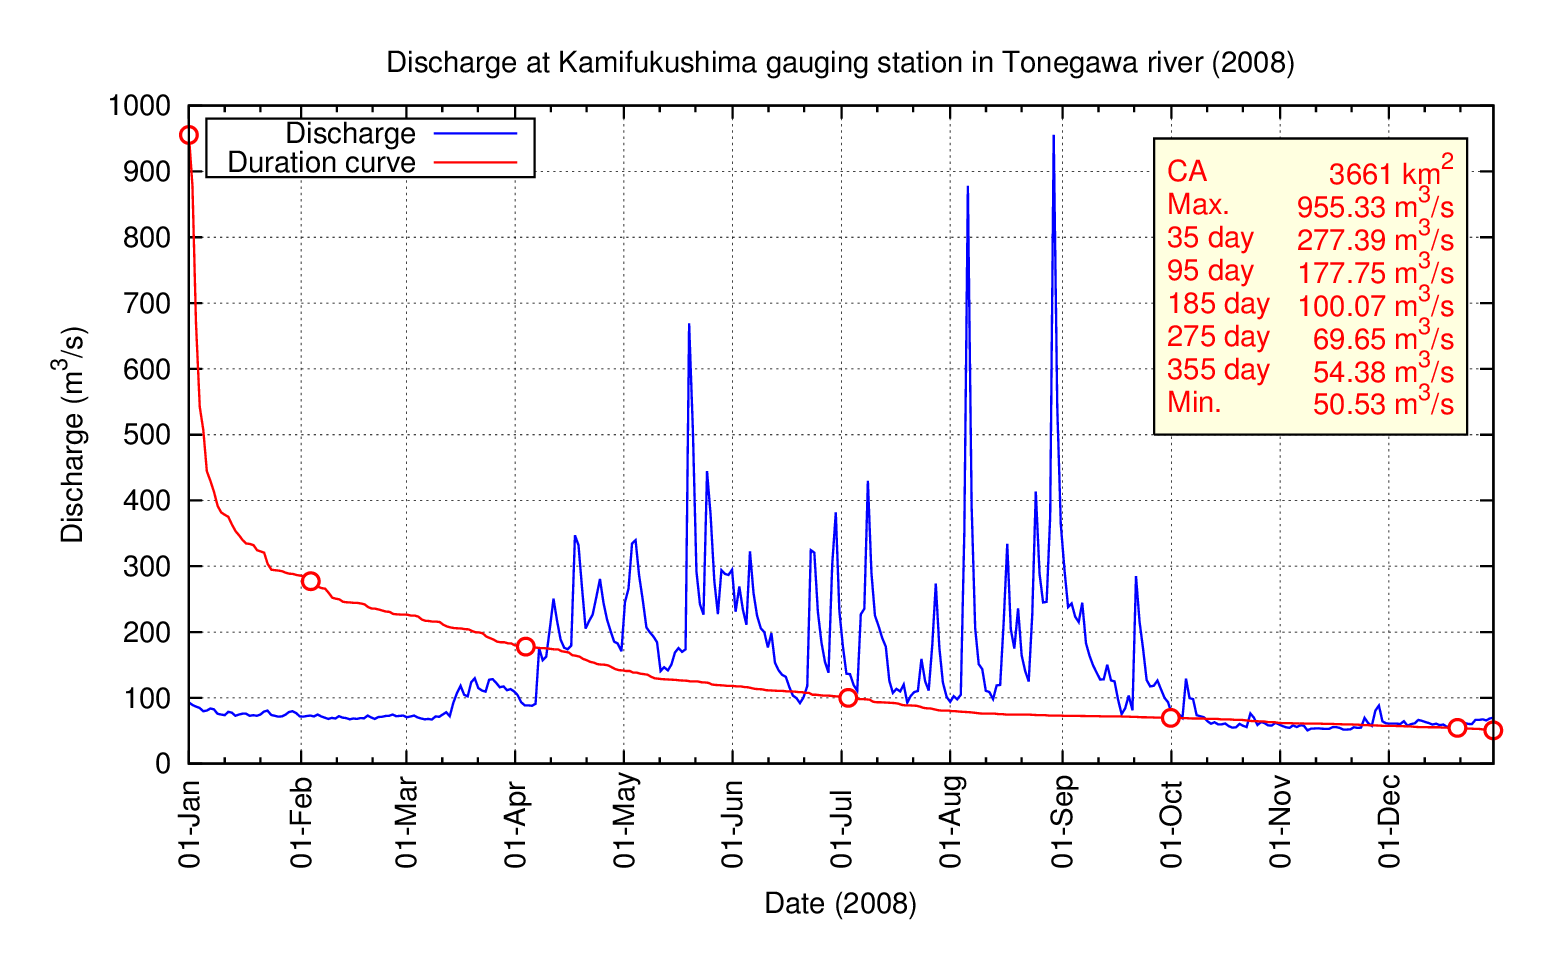
Time-sequence diagram (daily variation of river discharge and duration curve)
Script, data and figure by gnuplot