Outline of this page
Bubble sort and Shell sort
Outline of this program
- This is a program for sorting of real numbers in ascending order.
- In this program, bubble sort method and Shell sort method are included.
Source code by f90
| Filename | Description |
|---|
| f90_SORT.txt | program for sorting of real numbers |
Bubble sort of character string
Outline of this program
- This is a program for sorting of character strings in ascending order.
- In this program, bubble sort method is used.
Source code by f90
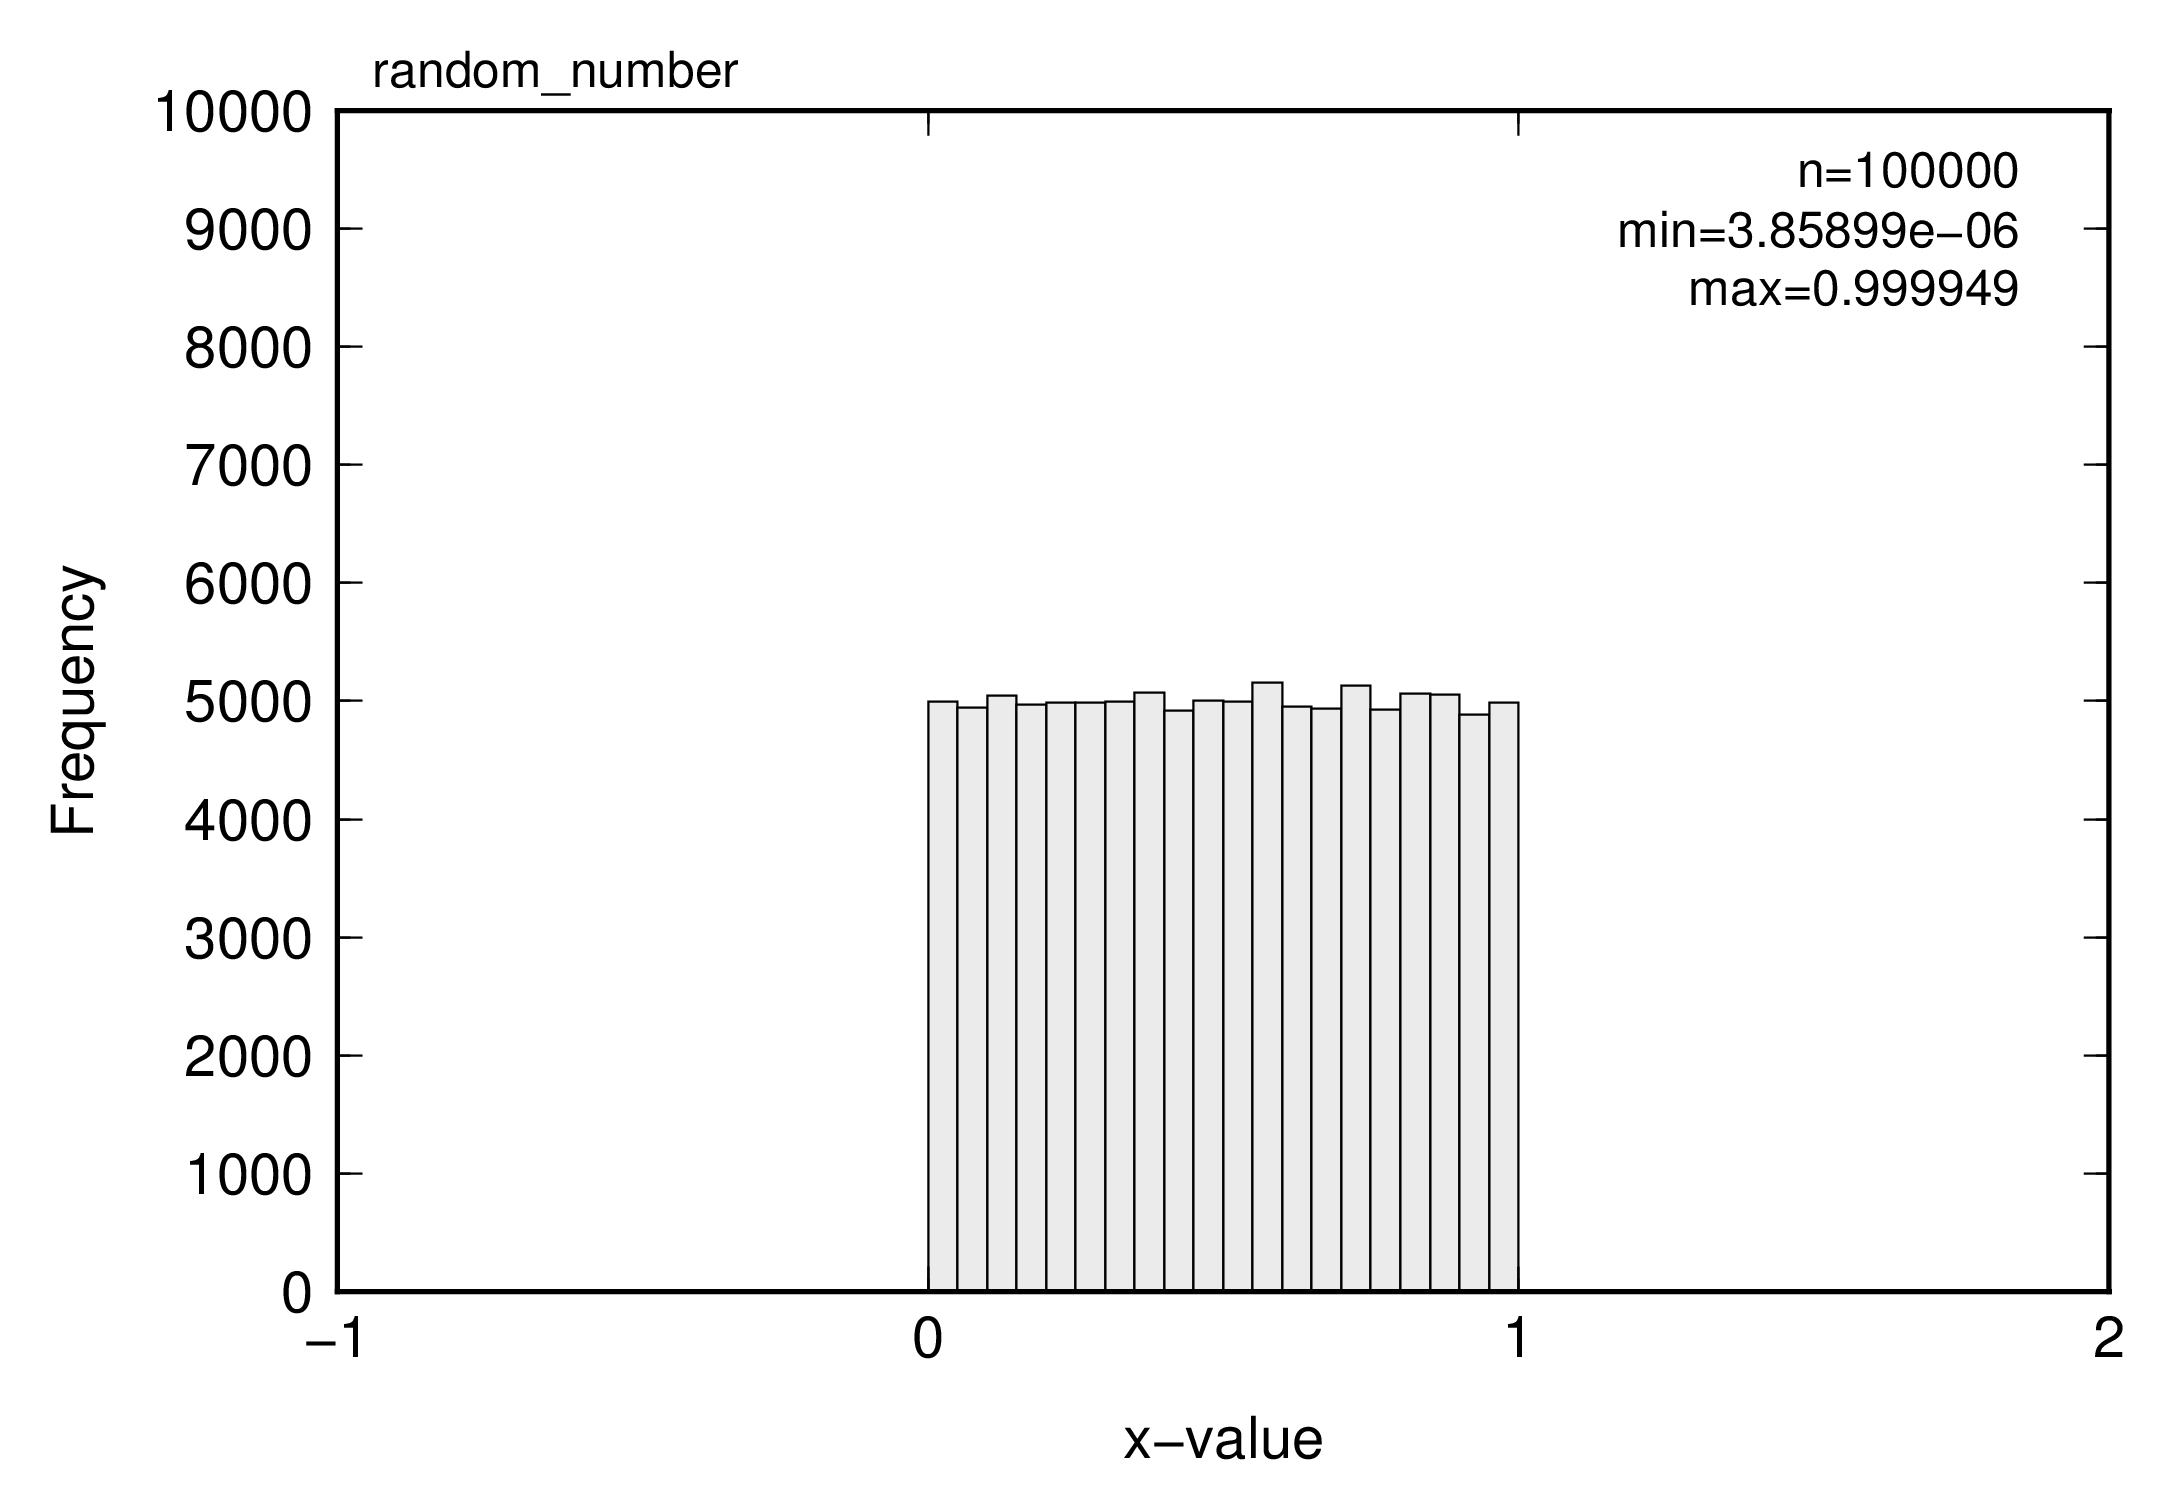
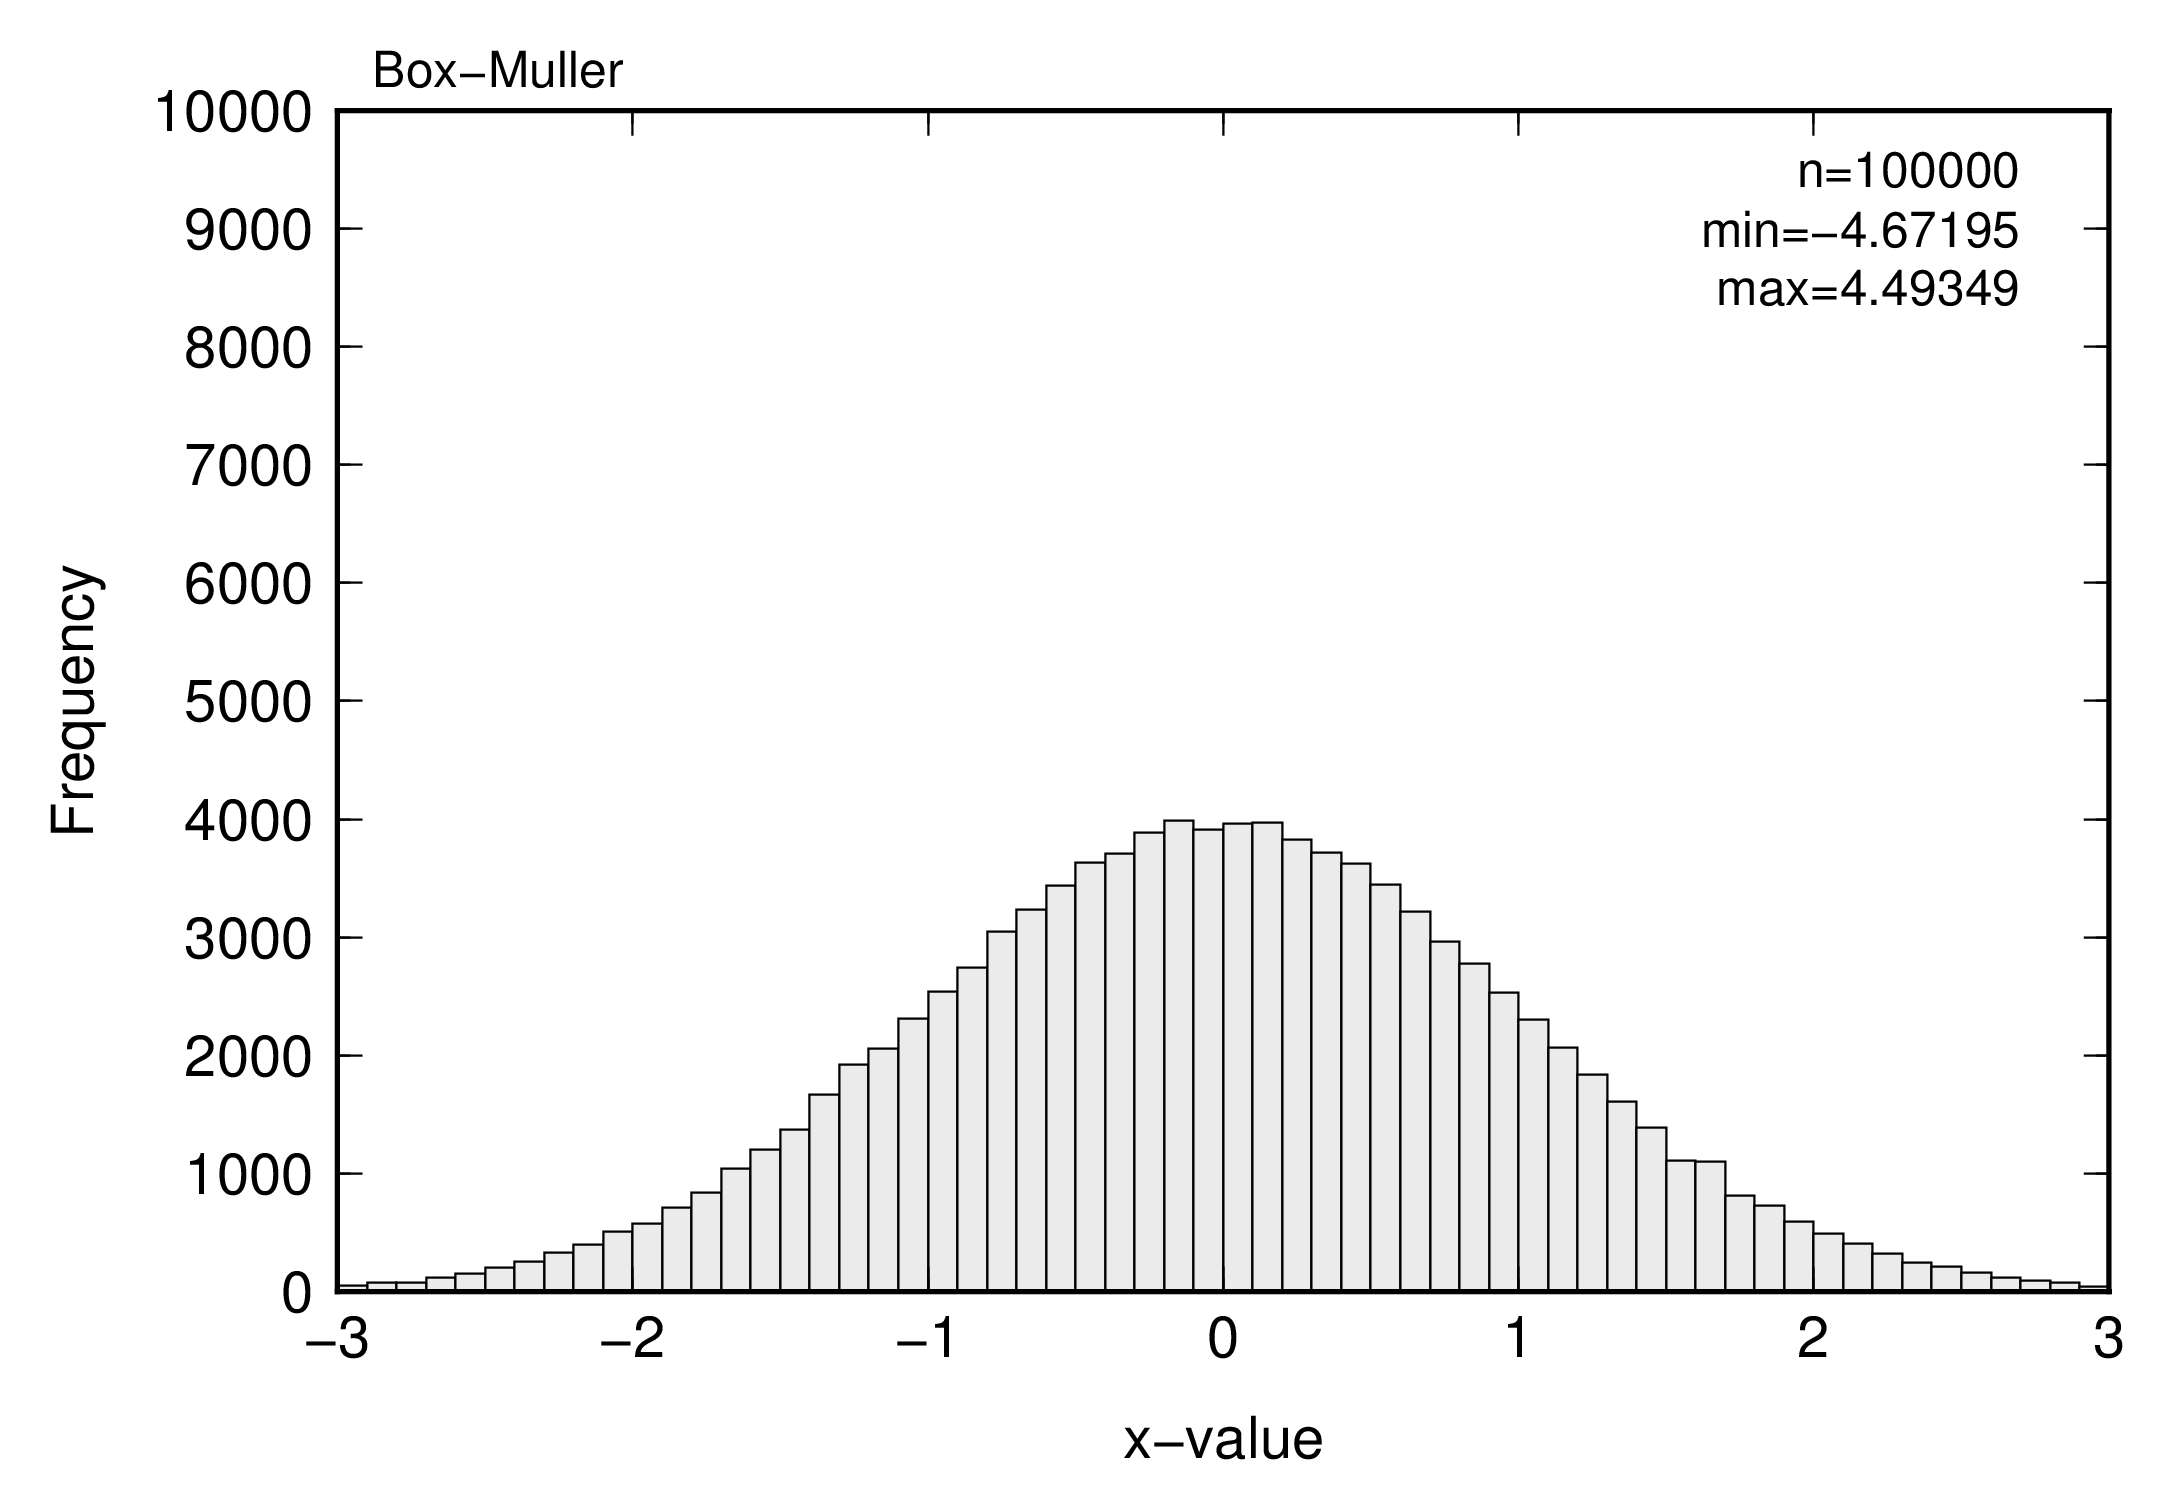
Random numbers
Outline of this program
- This is a program to give uniform random number in the interval (0,1] and normal random number with distribution of zero expectation and unit variance.
- Uniform random number is given using a built-in subroutine of 'random_number()' on Fortran90.
- Normal random number is given using Box-Muller method.
Source code by f90 and output sample by GMT
| Filename | Description |
|---|
| f90_RAND.txt | program for random number generation |
| fig_RU.png | Sample figure of uniform random numbers by GMT |
| fig_RN.png | Sample figure of normal random numbers by GMT |
Get date and time
Outline of this program
- This is a program for getting date and time when this program was executed using built-in subroutine 'date_and_time.'
Source code by f90
| Filename | Description |
|---|
| f90_DATE.txt | Program to get date and time |
Get calculation time
Outline of this program
- This is a program for getting calculation time using built-in subroutine 'system_clock.'
- As a reference, sample use of Fortran95 built-in subroutine 'cpu_time' is also shown in this program.
Source code by f90
| Filename | Description |
|---|
| f90_TIME.txt | Program to get calculation time |
Convert Decimal digits to Hexadecimal digits
Outline of this program
- This is a program for converting Decimal digits to Hexadecimal digits.
Source code by f90
| Filename | Description |
|---|
| f90_10to16.txt | Program to convert Decimal digits to Hexadecimal digits |
Create color strip gif images and HTML file to show them
Outline of this program
- This is a program for creating color strip gif images and HTML file to show them.
- This program is for the color of GMT, gnuplot and ImageMagick.
- Color strip gif images are created using ImageMagick.
- Execution of ImageMagick commands is carried out by making batch file of commands and execution of it in Fortran program.
- Color names are arranged in ascending order using the gawk function asort.
- Batch commands for execution of Fortran program are shown below.
gfortran -o f90_COL_HTML.exe f90_COL_HTML.f90

f90_COL_HTML n c:\WANtaroHP_COL\col_inp_GPL.txt c:\WANtaroHP_COL\zesubGPLcol.html
f90_COL_HTML n c:\WANtaroHP_COL\col_inp_GMT.txt c:\WANtaroHP_COL\zesubGMTcol.html
f90_COL_HTML n c:\WANtaroHP_COL\col_inp_IMK.txt c:\WANtaroHP_COL\zesubIMKcol.html
In above commands, argument n is flag for making gif image.
In this case, gif images of color strip are not created by ImageMagick.
If y is inputted, ImageMagick makes many gif images of color strip.
Source code by f90
Awk script for HTML color
For HTML color, following awk script and data are used. Commands for execution of awk script is shown below.
gawk -f awk_html_col.awk dat_html_col.txt > zesubHTMLcol.html
Create font strip gif images and HTML file to show them
Outline of this program
- This is a program for creating font strip gif images and HTML file to show them.
- Valid fonts are only installed fonts in your PC.
- Font strip gif images are created using ImageMagick.
- Execution of ImageMagick commands is carried out by making batch file of commands and execution of it in Fortran program.
- Font names are arranged in ascending order using the gawk function asort.
- Batch commands for execution of Fortran program are shown below.
gfortran -o f90_IMFONT.exe f90_IMFONT.f90

f90_IMFONT n c:\WANtaroHP_Font\inp_fname.txt c:\WANtaroHP_Font\zesubIMKfont.html
In above commands, argument n is flag for making gif image.
In this case, gif images of font strip are not created by ImageMagick.
If y is inputted, ImageMagick makes many gif images of font strip.
Source code by f90
Get the distance between 2 points with longitudes and latitudes
Outline of this program
- This is a program for calculating the thistance between 2 points with longitudes and latitudes.
- Following webpages were refered for making this program.
Commandline input/output
Sample batch file for execution of F90 program and result
Batch file
gfortran -o f90_DIST.exe f90_DIST.f90

rem distance from Kuala Lumpur to Tokyo
f90_DIST 101.55 3.117 139.76 35.69

rem distance from Kuala Lumpur to Jakarta
f90_DIST 101.55 3.117 106.833 -6.183

rem distance from Kuala Lumpur to Bangkok
f90_DIST 101.55 3.117 100.567 13.733

rem distance from Kuala Lumpur to Vientiane
f90_DIST 101.55 3.117 102.567 17.95

rem distance from Kuala Lumpur to Ha Noi
f90_DIST 101.55 3.117 105.800 21.017

rem distance from Kuala Lumpur to Seoul
f90_DIST 101.55 3.117 126.967 37.567

rem distance from Kuala Lumpur to Beijing
f90_DIST 101.55 3.117 116.283 39.933
Result
Location     Lon(deg) Lat(deg) GSI(km)   L-A(km)   Hubeny(km)
Kuala Lumpur 101.550   3.117   ---       ---       ---
Tokyo        139.760  35.690   5332.871  5332.837  5395.254
Jakarta      106.833  -6.183   1184.251  1184.231  1184.532
Bangkok      100.567  13.733   1179.183  1179.106  1179.090
Vientiane    102.567  17.950   1644.567  1644.533  1644.471
Ha Noi       105.800  21.017   2033.151  2033.150  2033.494
Seoul        126.967  37.567   4612.771  4612.781  4646.478
Beijing      116.283  39.933   4339.904  4339.820  4352.810
- GSI: Geospatial Information Authority of Japan
- http://vldb.gsi.go.jp/sokuchi/surveycalc/bl2stf.html
- L-A: Lambert-Andyer's formula
- Hubeny: Hubeny's formula
Source code by f90
| Filename | Description |
|---|
| f90_DIST.txt | Program to calculate the distance between 2 points |
File input and output of distance matrix
Sample batch file for execution of F90 program
gfortran -o f90_DIST1.exe f90_DIST1.f90

f90_DIST1 inp_city.txt out_city.csv
Source code by f90
Create Calender by html document
Outline of this program
- These programs can create some calenders using html format for each specified month or year.
- Basic mathematical techniques are that one is to find what day of week, and another is to judge leap year or not.
Referenced web pages are shown below.
- http://ja.wikipedia.org/wiki/ツェラーの公式
- http://en.wikipedia.org/wiki/Zeller%27s_congruence
- http://ja.wikipedia.org/wiki/閏年
- http://en.wikipedia.org/wiki/Leap_year
- It is possible to add some comments to the calender using input file prepared separately.
- Back ground image of a day element on table in html calender is created by ImageMagick.
Batch file for execution
01 | rem **************************
02 | rem Required files
03 | rem   inp_2013_2nd_half.txt
04 | rem   f90_CALDAT.f90
05 | rem   f90_CALENDER.f90
06 | rem   f90_CALSMALL.f90
07 | rem **************************
08 |
09 | gfortran -o f90_CALDAT.exe f90_CALDAT.f90
10 | f90_CALDAT 240 60 192 64 255 192
11 | rem f90_CALDAT 240 60 255 255 255 255
12 |
13 | gfortran -o f90_CALENDER.exe f90_CALENDER.f90
14 | f90_CALENDER 20130125 inp_2013_2nd_half.txt cal_201301.html
15 | f90_CALENDER 20130225 inp_2013_2nd_half.txt cal_201302.html
16 | f90_CALENDER 20130325 inp_2013_2nd_half.txt cal_201303.html
17 | f90_CALENDER 20130425 inp_2013_2nd_half.txt cal_201304.html
18 | f90_CALENDER 20130525 inp_2013_2nd_half.txt cal_201305.html
19 | f90_CALENDER 20130625 inp_2013_2nd_half.txt cal_201306.html
20 | f90_CALENDER 20130725 inp_2013_2nd_half.txt cal_201307.html
21 | f90_CALENDER 20130825 inp_2013_2nd_half.txt cal_201308.html
22 | f90_CALENDER 20130925 inp_2013_2nd_half.txt cal_201309.html
23 | f90_CALENDER 20131025 inp_2013_2nd_half.txt cal_201310.html
24 | f90_CALENDER 20131125 inp_2013_2nd_half.txt cal_201311.html
25 | f90_CALENDER 20131225 inp_2013_2nd_half.txt cal_201312.html
26 |
27 | gfortran -o f90_CALSMALL.exe f90_CALSMALL.f90
28 | f90_CALSMALL 2011 cal_all_2011.html
29 | f90_CALSMALL 2012 cal_all_2012.html
30 | f90_CALSMALL 2013 cal_all_2013.html
31 | f90_CALSMALL 2014 cal_all_2014.html
32 |
33 | del img1.png
34 | del img2.png
35 | del imgm.png
36 | del temp1.png
37 | del temp2.png
38 | del tempi.png
- 01-07
- Comments
- 09-10
- Compile and execute the program of f90_CALDAT
- 13-25
- Compile and execute the program of f90_CALENDER
- 27-31
- Compile and execute the program of f90_CALSMALL
- 33-38
- Delete work files for making image
Arguments in command line for f90_CALDAT
This program can define the color of calender and create the top page for showing calender.
f90_CALDAT Hmax Hmin Smax Smin Vmax Vmin
| f90_CALDAT | executed program name |
| Hmax, Hmin | Maximim and minimum value of H in HSV color model |
| Smax, Smin | Maximim and minimum value of S in HSV color model |
| Vmax, Vmin | Maximim and minimum value of V in HSV color model |
In the sample baych file shown above, monthly average temperatures in Maebashi are related using following manner.
| Temperature | Min. | ⇐ Middle ⇒ | Max. |
|---|
| Hue | Max. | ⇐ Middle ⇒ | Min. |
| Saturation | Min. | ⇐ Middle ⇒ | Max. |
| Value | Min. | ⇐ Middle ⇒ | Max. |
Average temperatures in Maebashi which is used as input data are defined as following code in the program of f90_CALDAT.f90.
real(4)::Te(1:12)=(/3.3,3.6,6.9,12.9,17.7,21.2,24.7,26.1,21.9,16.1,10.5,5.8/)
Arguments in command line for f90_CALENDER
This program can create a calender for specified one month.
f90_CALENDER yyyymmdd fnameR fnameW
| f90_CALENDER | executed program name |
| yyyymmdd | specified date (yyyy: year, mm: month, dd: day) |
| fnameR | Input file name for comments (it shall be text file) |
| fnameW | Output file name (it shall be html file) |
Arguments in command line for f90_CALSMALL
This program can create all days calender for specified one year.
| f90_CALSMALL | executed program name |
| yyyy | specified year |
| fnameW | Output file name (it shall be html file) |
Source code by f90 and related documents
Create Color circle based on HSV color model by GMT
Outline of this program
- This is a program to create some parts of commands for GMT, and GMT can draw a Color circle.
- The definition of Hue (H) is done based on this site (http://homepage3.nifty.com/ishidate/vcpp_color/vcpp_color.htm).
- The conversion from HSV to RGB is done based on this site (http://www.technotype.net/tutorial/tutorial.php?fileId={Image%20processing}§ionId={-converting-between-rgb-and-hsv-color-space}).
| Difinition of Hue |
|---|
| Range of angle | R | G | B | Coloe name |
|---|
| 0/60 | max | min->max | min | Red->Yellow |
| 60/120 | max->min | max | min | Yellow->Lime |
| 120/180 | min | max | min->max | Green->Cyan |
| 180/240 | min | max->min | max | Cyan->Blue |
| 240/300 | min->max | min | max | Blue->Magenta |
| 300/360 | max | min | max->min | Magenta->Red |
| Range of variables |
|---|
| | R | G | B | H | S | V |
|---|
| Max. | 255 | 255 | 255 | 359 | 255 | 255 |
|---|
| Min. | 0 | 0 | 0 | 0 | 0 | 0 |
|---|
| Kind | integer | integer | integer | integer | integer | integer |
|---|
| R: red, G: green, B: blue |
| H: hue, S: saturation, V: value |
Batch file for execution
gfortran -o f90_COLCIRC.exe f90_COLCIRC.f90

f90_COLCIRC 1 255 255 > bat_gmt_exe.bat
set fig=fig_gmt_colcirc1.eps
call bat_gmt_colcirc

f90_COLCIRC 1 128 255 > bat_gmt_exe.bat
set fig=fig_gmt_colcirc2.eps
call bat_gmt_colcirc

f90_COLCIRC 1 255 192 > bat_gmt_exe.bat
set fig=fig_gmt_colcirc3.eps
call bat_gmt_colcirc

f90_COLCIRC 1 128 192 > bat_gmt_exe.bat
set fig=fig_gmt_colcirc4.eps
call bat_gmt_colcirc

f90_COLCIRC 60 255 255 > bat_gmt_exe.bat
set fig=fig_gmt_colcirc0.eps
call bat_gmt_colcirc

del _*
Program name executed is f90_COLCIRC.
Command line arguments are 'Increment of H-value', 'S-value', 'V-value' in HSV-color system and 'Output file name'.
In the output file, the parts of commands for GMT are written, and another control file is required to execute GMT.
Source code by f90 and related documents
Create Color strips based on HSV color model by ImageMagick
Outline of this program
- This is a program to create color strips using ImageMagick and html document which shows color strips.
- Color strips created by this program are shown below.
| H | S=255 | S=128 | S= 64 | S= 64 | S= 32 | S= 16 |
|---|
| (deg) | V=255 | V=255 | V=255 | V=192 | V=192 | V=192 |
|---|
| 0 |
 |
 |
 |
 |
 |
 |
| 30 |
 |
 |
 |
 |
 |
 |
| 60 |
 |
 |
 |
 |
 |
 |
| 90 |
 |
 |
 |
 |
 |
 |
| 120 |
 |
 |
 |
 |
 |
 |
| 150 |
 |
 |
 |
 |
 |
 |
| 180 |
 |
 |
 |
 |
 |
 |
| 210 |
 |
 |
 |
 |
 |
 |
| 240 |
 |
 |
 |
 |
 |
 |
| 270 |
 |
 |
 |
 |
 |
 |
| 300 |
 |
 |
 |
 |
 |
 |
| 330 |
 |
 |
 |
 |
 |
 |
Batch file for execution
gfortran -o f90_HSVrgbHEX.exe f90_HSVrgbHEX.f90

f90_HSVrgbHEX
Source code by f90 and related documents
Point inclusion test for plane polygon
Outline of this program
- This is a program for the point inclusion test for plane polygon.
- The purpose of making this program is to define the domain for FEM elements.
Sample input data
2                         Number of domain
8                         Number of coordinates for the first domain
 0.7  0.0                 (x,y) coordinates for the first domain
 0.1  0.1
 0.0  0.7
-0.1  0.1                  (Definition of the blue area in the sample drawing)
-0.7  0.0
-0.1 -0.1
 0.0 -0.7
 0.1 -0.1
8                         Number of coordinates for the second domain
 0.50  0.50               (x,y) coordinates for the second domain
 0.05  0.00
 0.50 -0.50
 0.00 -0.05                (Definition of the green area in the sample drawing)
-0.50 -0.50
-0.05  0.00
-0.50  0.50
 0.00  0.05
200000                    Number of coordinates for the inclusion test
-0.524425 -0.417869       (x,y) coordinates for the testing
0.691628 -0.695583        Total number of inputted coordinates is 200,000.
0.171075 -0.613049        The ranges of coordinates are (x,y)=(-1 / 1, -1 / 1).
・・・・・
Sample batch file for execution
gfortran -o f90_DOMAIN.exe f90_DOMAIN.f90

f90_DOMAIN inp_dom2.txt

rem *** GMT commands for drawing ***
set range=-1/1/-1/1
set paper=10/10
set inp0=_mat_00.txt
set inp1=_mat_01.txt
set inp2=_mat_02.txt
set fig=fig_gmt_dom2.eps
psxy %inp1% -R%range% -JX%paper% -SC0.01 -G0/0/255 -P -K > %fig%
psxy %inp2% -R -J -SC0.01 -G0/255/0 -O -K >> %fig%
psxy %inp0% -R -J -SC0.01 -G255/0/0 -O >> %fig%
Sample drawing
Sample drawing is made based on following rules.
Source code by f90 and related documents


