Single Regression Analysis
Outline of this program
- This is a program for single regression analysis.
- Coefficient aa, coefficient bb and a correlation coefficient in regression line y=aa*x+bb can be obtained using this program.
Source code by f90
| Filename | Description |
|---|---|
| f90_KAIKI.txt | program for single regression analysis |
Multiple Regression Analysis
Outline of this program
- This is a program for multiple regression analysis.
- Regression formula is y=b0+b1*x1+b2*x2+b3*x3+....
where, y is response variable, bi are partial regression coefficients and xi are explanatory variables. - Simultaneous linear equations are solved using simple Gauss-Jordan elimination.
Format of input data file
 001 | Sample data
 002 | 4,46
 003 | 44523,6364,90547,19.7,640.9
 004 | 10395,7135,12634,20.0,128.2
 005 |  8669,7266,20101,16.3,113.8
..........
- 001
- Comment
- 002
- Number of explanatory variables (=4), number of input data sets (=46)
- 003
- (In this case, y-value and four x-values)
- 004
- (Lower rows from row 3 are y and x-values of data)
Bach command for execution
gfortran -o f90_MRA.exe f90_MRA.f90
f90_MRA inp_MRA.txt out_MRA.txt
Format of execution command
f90_MRA fnameR fnameW
| f90_MRA | Execution file of f90 |
| fnameR | Input file name |
| fnameW | Out put faile name |
Source code by f90
| Filename | Description |
|---|---|
| f90_MRA.txt | Program for multiple regression analysis |
| inp_MRA.txt | Sample input data |
| out_MRA.txt | Sample output data |
| R_DRAWinp.txt | R script for drawing of input data |
| R_DRAWout.txt | R script for drawing of output data |
| fig_MRA_inp.pdf | Sample image of input data |
| fig_MRA_out.pdf | Sample image of output data |
Principal Component Analysis
Outline of this program
- This is a program for principal component analysis.
- Eigenvalues and eigenvectors are obtained using Jacobi eigenvalue algorithm.
Format of input data file
 001 | iris
 002 | 4,150
 003 | 5.1,3.5,1.4,0.2,setosa,1
 004 | 4.9,3.0,1.4,0.2,setosa,2
 005 | 4.7,3.2,1.3,0.2,setosa,3
..........
- 001
- Comment
- 002
- Number of variables (=4), number of input data sets (=150).
- 003
- (In this case, four values, No.5 and 6 columns are not available.)
- 004
- (Lower rows from row 3 are values of data)
Bach command for execution
gfortran -o f90_PCA.exe f90_PCA.f90

f90_PCA 1 1 inp_iris.csv out_iris.csv

rscript R_DRAWinp.R
ren Rplots.pdf fig_R_PCA_inp.pdf

rscript R_DRAWout.R
ren Rplots.pdf fig_R_PCA_out.pdf
Format of execution command
f90_PCA knor kvok fnameR fnameW
| f90_PCA | Execution file of f90 |
| knor | Index for normalization (0: yes, 1: No) |
| kvok | Index for Var. or Cor. (0: use variance-covariance matrix, 1: use correlation matrix) |
| fnameR | Input file name |
| fnameW | Out put faile name |
Source code by f90
| Filename | Description |
|---|---|
| f90_PCA.txt | Program for principal component analysis |
| inp_iris.txt | Sample input data |
| out_iris.txt | Sample output data |
| R_DRAWinp.txt | R script for drawing of input data |
| R_DRAWout.txt | R script for drawing of output data |
| fig_PCA_inp.pdf | Sample image of input data |
| fig_PCA_out.pdf | Sample image of output data |
Percent point and Probability of exceedance in Standard Normal Distribution
Outline of this program
- This is a program to give a percent point and probability of exceedance in Standard Normal Distribution.
- To obtain the percent point, approximation method by TODA is used.
- To obtain the probability of exceedance, approximation method by SHENTON is used.
Source code by f90
| Filename | Description |
|---|---|
| f90_TODAPP.txt | program for calculation of percent point and exceedance probability |
| inp_TODAPP.txt | Sample input data |
| out_TODAPP.txt | Sample output data |
Probability Ellipse
Outline of this program
- Two programs named f90_SREG.f90 and f90_ELLIP.f90 are introduced in this section.
- The program f90_SREG.f90 is for Single regression analysis and finding the characteristics of the probability ellipse.
- The program f90_ELLIP.f90 is for creating input data for 'Se' option in GMT. 'Se' is an option of 'psxy' command in GMT, and it can draw an ellipse without many plot values. In this program, the formula of ellipse which is derived using given three points is conducted, and the rotated angle, major and minor axis of the ellipse are finded by solving the non-linear simultaneous equations.
Bach command for execution
gfortran -o f90_SREG.exe f90_SREG.f90
gfortran -o f90_ELLIP.exe f90_ELLIP.f90

f90_SREG inp_reg1.txt 0.95 > out_reg1.txt
gawk "15<=NR{print $2,$3}" out_reg1.txt > inp_elp1.txt
f90_ELLIP inp_elp1.txt 5 5 5 3 > _elp11.txt
f90_ELLIP inp_elp1.txt 5 5 5 5 > _elp12.txt
The format of command line arguments are shown below.
f90_SREG fnameR pp > fnameW
| f90_SREG | Compiled F90 frogram for finding the characteristics of the probability ellipse |
| fnameR | Input file name |
| pp | Value of non-exceedance probability for the probability ellipse |
| fnameW | Output file name |
f90_ELLIP fnameR LX LY dx,dy > fnameW
| f90_ELLIP | Compiled F90 frogram for creating the input data for GMT |
| fnameR | Input file name |
| LX | Length of x-axis of the graph in the unit of 'cm' |
| LY | Length of y-axis of the graph in the unit of 'cm' |
| dx | Range of x-axis (maximum x-value minus minimum x-value on the x-axis of the graph) |
| dy | Range of y-axis (maximum y-value minus minimum y-value on the y-axis of the graph) |
| fnameW | Output file name |
Source code by f90
| Filename | Description |
|---|---|
| f90_SREG.txt | Program for single regression and probability ellipse |
| f90_ELLIP.txt | Program for creating data for GMT drawing |
| inp_reg1.txt | Input data sample |
| en_TeX_ellipse.pdf | Document of theory and output sample |
Cluster Analysis (K-means++ method)
Outline of this program
- This is a program for cluster analysis.
- K-means++ method is used as a solution for cluster analysis.
- Algorithm to take k number's initial centers is shown below:
- (0) Set the number of cluster k and prepare 3 variables as vectors {D1},{D2} and {DR} in order to keep calculated distances.
- (1) Take 1st center point as c1 from data set using random number.
- (2) Put the dummy values into vector {D1}, which has huge figures.
- (3) Calculate the distance between center point c1 and all points, and put them into the vector {D2}.
- (4) Compare the element in {D1} with the element in {D2} and set a smaller value into {DR}.
- (5) Set 2nd center point as c2 which has maximum value in {DR}.
- (6) Set {D1}={DR} and repeat the procedure from (3) to (6) until getting k number's centers.
Format of input data file
Format of input data is the same as it for principal component analysis.
 001 | iris
 002 | 4,150
 003 | 5.1,3.5,1.4,0.2,setosa,1
 004 | 4.9,3.0,1.4,0.2,setosa,2
 005 | 4.7,3.2,1.3,0.2,setosa,3
..........
- 001
- Comment
- 002
- Number of variables (=4), number of input data sets (=150).
- 003
- (In this case, four values, No.5 and 6 columns are not available.)
- 004
- (Lower rows from row 3 are values of data)
Bach command for execution
gfortran -o f90_KMEANSPP.exe f90_KMEANSPP.f90

f90_KMEANSPP 0 3 30 inp_iris.csv out_iris0.txt
f90_KMEANSPP 2 3 30 inp_iris.csv out_iris2.txt

del fig_R_CLUSinp.pdf
del fig_R_CLUSpca_0.pdf
del fig_R_CLUSpca_2.pdf
del fig_R_CLUSmds_0.pdf
del fig_R_CLUSmds_2.pdf

rscript R_CLUSinp.R inp_iris.csv
ren Rplots.pdf fig_R_CLUSinp.pdf

rscript R_CLUSpca.R out_iris0.txt
ren Rplots.pdf fig_R_CLUSpca_0.pdf
rscript R_CLUSpca.R out_iris2.txt
ren Rplots.pdf fig_R_CLUSpca_2.pdf

rscript R_CLUSmds.R out_iris0.txt
ren Rplots.pdf fig_R_CLUSmds_0.pdf
rscript R_CLUSmds.R out_iris2.txt
ren Rplots.pdf fig_R_CLUSmds_2.pdf
Format of execution command
f90_KMEANSPP imethod kk mds fnameR fnameW
| f90_KMEANPP | Execution file of f90 |
| imethod | calculation method of distance (0: mahalanobis, 1: City block, 2: Euclidean, >=3: Minkowski) |
| kk | Number of cluster |
| mds | Minimum size of one cluster |
| fnameR | Input file name |
| fnameW | Out put faile name |
Source code by f90
| Filename | Description |
|---|---|
| f90_KMEANSPP.txt | Program for cluster analysis |
| inp_iris.txt | Sample input data |
| out_iris0.txt | Sample output data (Mahalanobis) |
| out_iris2.txt | Sample output data (Euclidean) |
| R_CLUSinp.txt | R script for drawing using input data |
| R_CLUSpca.txt | R script for drawing using PCA |
| R_CLUSmds.txt | R script for drawing using MDS |
| fig_R_CLUSinp.pdf | Sample image (input data) |
| fig_R_CLUSpca_0.pdf | Sample image (Mahalanobis,PCA) |
| fig_R_CLUSpca_2.pdf | Sample image (Euclidean, PCA) |
| fig_R_CLUSmds_0.pdf | Sample image (Mahalanobis,MDS) |
| fig_R_CLUSmds_2.pdf | Sample image (Euclidean, MDS) |
Multi-Dimensional Scaling
Outline of this program
- This is a program for classical Multi-Dimensional Scaling.
- The procedure of analysis is shown below:
- (0) Observed vector data with dimension n x m can be inputed. In this case, distance matrix with dimension n x n shall be calculated before following procedure.
- (1) Input a distance matrix (proximity matrix) [d] with dimension n x n.
- (2) Make squared matrix [D], its element is squared value of the element of [d].
- (3) Make matrix [B] from a matrix [D] using Young - Householder transformation.
where, [B]=-0.5*[J][D][J], centering matrix [J]=[I]-1/n*{1}{1}T
{1}={1, 1, 1, ... ,1, 1}T - (4) Obtain the eigenvalues {λi} (λ1>=λ2>=λ3>= ... >=λn) and eigen vectors [E] of matrix [B].
- (5) Obtain the coordinate matrix [Xm]=[Em][Λm]1/2.
where, [Λm] is the diagonal matrix of eigenvalues, and the element λi=1 to m in the matrix [Λm] shall be more than or equal to zero. - (6) Make plots of obtained coordinates.
Format of input data file
Vector data input (inp_iris.csv)
Format of input data is the same as it for principal component analysis.
 001 | iris
 002 | 4,150
 003 | 5.1,3.5,1.4,0.2,setosa,1
 004 | 4.9,3.0,1.4,0.2,setosa,2
 005 | 4.7,3.2,1.3,0.2,setosa,3
..........
- 001
- Comment
- 002
- Number of variables (=4), number of input data sets (=150).
- 003
- (In this case, four values, No.5 and 6 columns are not available.)
- 004
- (Lower rows from row 3 are values of data)
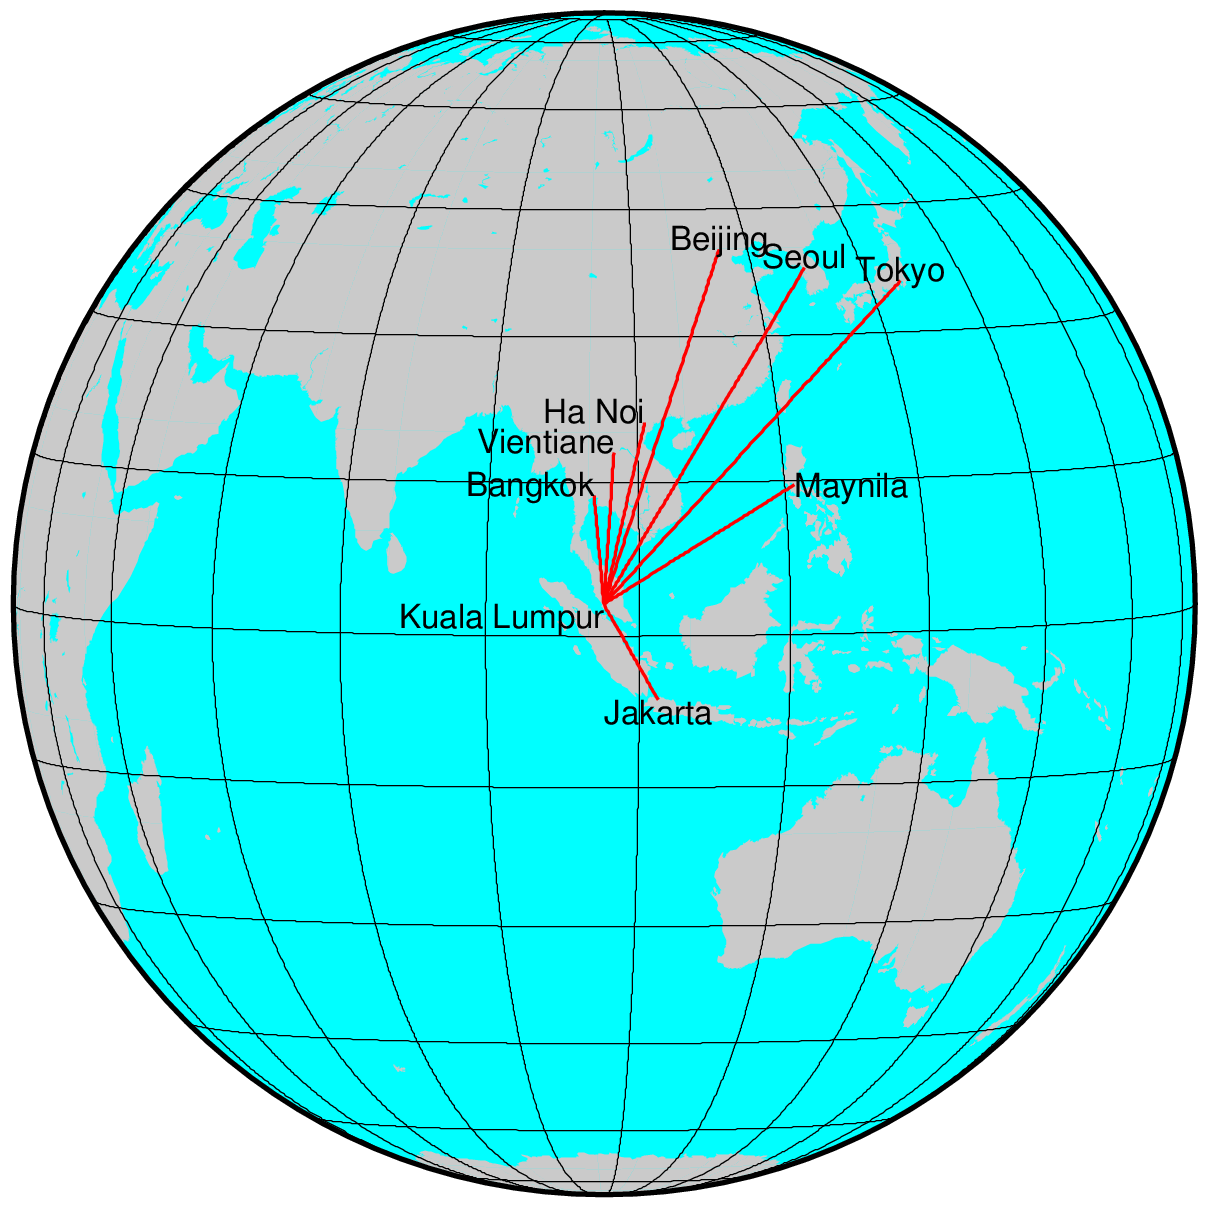
Distance matrix input (inp_map.csv)
 001 | Distance
 002 | 9
 003 | KL       , 0
 004 | Tokyo    , 5332.837,  0
 005 | Jakarta  , 1184.231,  5774.036,  0
 006 | Bangkok  , 1179.106,  4605.718,  2308.805,  0
 007 | Vientiane, 1644.533,  4151.984,  2710.010,  513.445,   0
 008 | Ha_Noi   , 2033.150,  3679.648,  3010.784,  979.078,   480.029,  0
 009 | Seoul    , 4612.781,  1162.077,  5275.036, 3715.257,  3223.101,  2743.357,   0
 010 | Beijing  , 4339.820,  2113.622,  5197.282, 3284.870,  2771.456,  2321.983,   964.494,  0
 011 | Maynila  , 2480.550,  2997.510,  2776.534, 2203.659,  2000.776,  1757.266,  2614.778,  2846.152, 0
- 001
- Comment
- 002
- Number of items (=9)
- 003-011
- Distance between capital cities
Bach command for execution
Example for vector data input (inp_iris.csv)
gfortran -o f90_MDS.exe f90_MDS.f90

f90_MDS 1 inp_iris.csv out_MDS_iris.csv

del fig_R_MDS_inp.pdf
del fig_R_MDS_out.pdf
rscript R_DRAWinp.R
ren Rplots.pdf fig_R_MDS_inp.pdf
rscript R_DRAWout_1.R
ren Rplots.pdf fig_R_MDS_out.pdf
Example for distance matrix input (inp_map.csv)
gfortran -o f90_MDS.exe f90_MDS.f90

f90_MDS 0 inp_map.csv out_MDS_map.csv

del fig_R_MDS_map.pdf
rscript R_DRAWout_0.R
ren Rplots.pdf fig_R_MDS_map.pdf
Format of execution command
f90_MDS knor fnameR fnameW
| f90_MDS | Execution file of f90 |
| knor | treatment of data (0: distance matrix input, 1: normalization of vector data, 2: no-normalization of vector data |
| fnameR | Input file name |
| fnameW | Out put faile name |
Source code by f90
| Filename | Description |
|---|---|
| f90_MDS.txt | Program for MDS |
| inp_iris.txt | Sample input data (vector data of 'iris') |
| out_MDS_iris.txt | Sample output data for 'iris' |
| inp_map.txt | Sample inpur data (distance matrix) |
| out_MDS_map.txt | Sample output data for 'map' |
| R_DRAWinp.txt | R script for drawing using input vector data |
| R_DRAWout_0.txt | R script for drawing of map |
| R_DRAWout_1.txt | R script for drawing of vector data |
| fig_R_MDS_inp.pdf | Sample image (input vector data) |
| fig_R_MDS_out.pdf | Sample image (output for vector data) |
| fig_R_MDS_map.pdf | Sample image (2-dim. map). Refer to below drawing. |
| fig_G_Malay.png | 2-dim.map by GMT (centering Kuala Lumpur) |