Formula for Non Uniform Flow Analysis
- The calculation formula to estimate a water surface profile is shown below. This equation means energy conservation between upstream section and downstream section with the distance of $\Delta x$ .
- In this equation, the slope of riverbed is included so that it can be adopted to steep slope flow analysis.
- Discharge $Q$ and characteristics of flow section as a function of water depth are known for all sections.
- For subcritical flow, the water depth at downstream edge of the domain of calculation is inputted and calculation is executed from downstream to upstream sequentially.
- For supercritical flow, the water depth at upstream edge of the domain of calculation is inputted and calculation is executed from upstream to downstream sequentially.
\begin{equation}
\left(\cfrac{Q_2^2}{2g A_2^2}+ h2\cos\theta + z2\right)-\left(\cfrac{Q_1^2}{2g A_1^2}+ h1\cos\theta + z1\right)=\cfrac{1}{2}\left(\cfrac{n_1^2 Q_1^2}{R_1^{4/3} A_2^2}+\cfrac{n_2^2 Q_2^2}{R_2^{4/3} A_1^2}\right) \Delta x
\end{equation}
| $Q_2$ | Discharge of upstream side | $Q_1$ | Discharge of downstream side | |
| $h_2$ | Water depth of upstream side | $h_1$ | Water depth of downstream side | |
| $z_2$ | Riverbed elevation of upstream side | $z_1$ | Riverbed elevation of downstream side | |
| $A_2$ | Flow area of upstream side | $A_1$ | Flow area of downstream side | |
| $R_2$ | Hydraulic radius of upstream side | $R_1$ | Hydraulic radius of downstream side | |
| $\Delta x$ | Distance between the sections | $n$ | Manning's roughness coefficient | |
| $g$ | Gravity acceleration | $\theta$ | Slope of riverbed |
The right side in above equation means the head loss due to friction. In general, the head loss due to friction and hydraulic gradient are described as follows.
\begin{equation}
h_r=f' \cfrac{\Delta x}{R}\cfrac{v^2}{2 g} \qquad \qquad I=\cfrac{h_r}{\Delta x}=f' \cfrac{1}{R}\cfrac{v^2}{2 g}
\end{equation}
When Manning's formula is used as a fomula of mean flow velocity,
\begin{equation}
v=\cfrac{1}{n}R^{2/3} I^{1/2}
\end{equation}
Coefficient related to the head loss can be obtained as follow.
\begin{equation}
f'=\cfrac{2 g n^2}{R^{1/3}}
\end{equation}
Then, the friction head loss can be calculated using following equation.
\begin{equation}
h_r=f' \cfrac{\Delta x}{R}\cfrac{v^2}{2 g}=\cfrac{n^2 v^2}{R^{4/3}}\Delta x=\cfrac{n^2 Q^2}{R^{4/3} A^2}\Delta x
\end{equation}
where, $Q$ means discharge, and $A$ means section area of flow.
In the above equation, when friction head loss $h_r$ is estimated using the mean characteristics between upstream section and downstream section with the distance of $\Delta x$ , the right side of the basic formula can be derived.
\begin{equation}
h_r=\cfrac{1}{2}\left(\cfrac{n_1^2 Q_1^2}{R_1^{4/3} A_1^2}+\cfrac{n_2^2 Q_2^2}{R_2^{4/3} A_2^2}\right)\Delta x
\end{equation}
Example of setting the river cross section model
Consider the composite cross section of the river.
 |
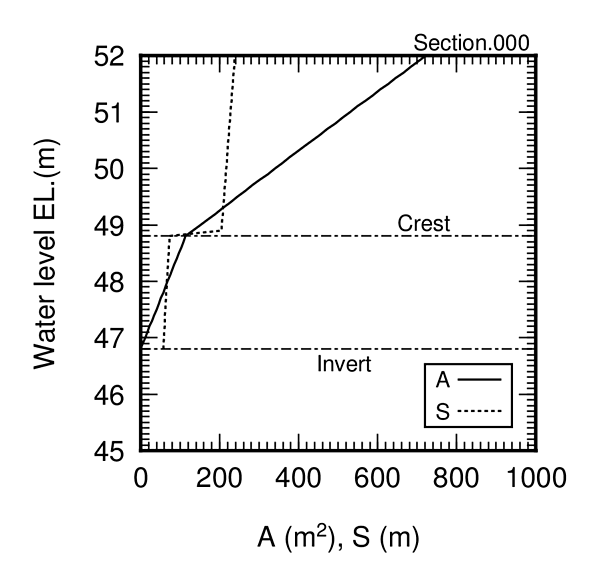
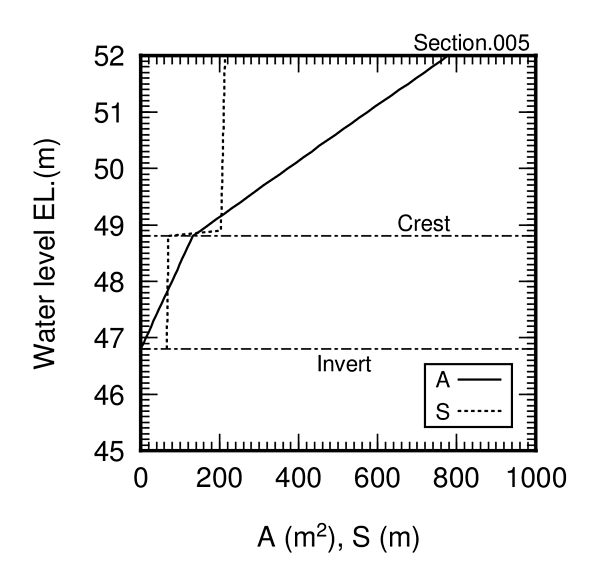
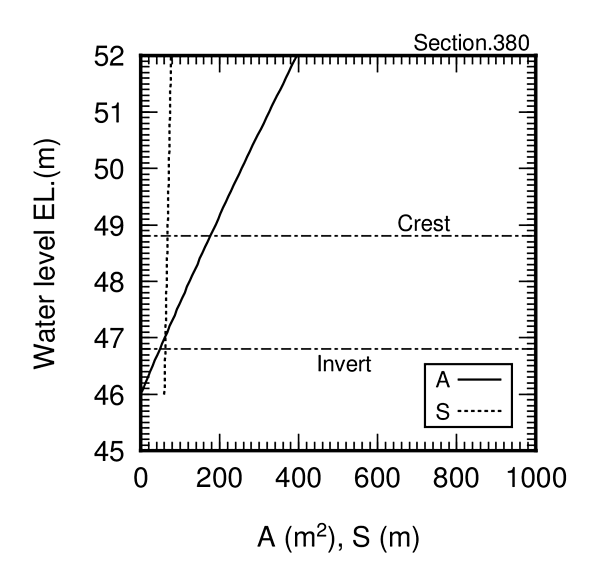
Refering the above figure, Section area $A$ , wetted perimeter $S$ and water surface width $T$ can be obtained as a function of the water depth $h$ shown below.
\begin{align*}
&h \leqq d \\
&\qquad A=\{2 b_1 + h (m_1+m_2)\}\cdot h/2 \\
&\qquad S=b_1+h \left(\sqrt{1+m_1^2}+\sqrt{1+m_2^2}\right) \\
&\qquad T=b_1+h (m_1+m_2) \\
&\quad \\
&d < h \\
&\qquad A=A_0+\{2 b_b + (h-d)(m_1+m_3)\}\cdot (h-d)/2 \\
&\qquad S=S_0+b_2+(h-d)\left(\sqrt{1+m_1^2}+\sqrt{1+m_2^2}\right)\\
&\qquad T=b_b+(h-d)(m_1+m_3)\\
&\qquad\qquad b_b=b_1+d(m_1+m_2)+b_2 \\
&\qquad\qquad A_0=\{2 b_1 + d (m_1+m_2)\}\cdot d/2 \\
&\qquad\qquad S_0=b_1+d \left(\sqrt{1+m_1^2}+\sqrt{1+m_2^2}\right)\\
\end{align*}
From above, if the section area $A$ and wetted perimeter $S$ are known, hydraulic radius $R$ can be calculated easily as a value of $R=A/S$ . The water surface width $T$ is used for the calculation of the critical depth. The critical depth $h\c$ can be obtained by solving the follow equation.
\begin{equation}
\left(\cfrac{A^3}{T}\right)_{h=h_c}=\cfrac{Q^2}{g \cos\theta}
\end{equation}
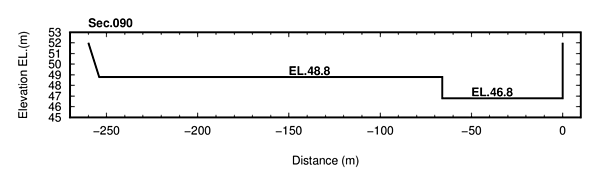
In this page, following characteristics of the flow section are used. 'xx' in below table means the distance from starting point of calculation to the point considered, and 'EL' means the riverbed elevation. The distance 'xx' is arranged from downstream section to upstream section, because subcritical flow was assumed in this case.
| xx | EL | b1 | b2 | d | m1 | m2 | m3 |
|---|---|---|---|---|---|---|---|
| (m) | (m) | (m) | (m) | (m) | |||
| 5.0 | 46.8 | 66.0 | 133.0 | 2.0 | 0.0 | 0.0 | 2.0 |
| 25.0 | 46.8 | 66.0 | 133.0 | 2.0 | 0.0 | 0.0 | 2.0 |
| 90.0 | 46.8 | 66.0 | 188.0 | 2.0 | 0.0 | 0.0 | 2.0 |
| 150.0 | 46.8 | 74.0 | 150.0 | 2.0 | 0.0 | 10.0 | 2.0 |
| 260.0 | 46.8 | 60.0 | 0.0 | 5.2 | 0.0 | 5.0 | 0.0 |
| 380.0 | 46.0 | 60.0 | 0.0 | 5.2 | 1.0 | 1.0 | 0.0 |
| 760.0 | 46.0 | 60.0 | 0.0 | 5.2 | 1.0 | 1.0 | 0.0 |
The feature of this model is that riverbed elevations at upstream parts are lower than that of downstream parts. Regarding the characteristics at 'xx=0', they were calculated separately because of all concrete section. In the actual calculation, the characteristics of flow section are interpolated with the distance of 5m.
 |
 |
 |
 |
 |
 |
 |
| Models of flow section |
|---|
 |
 |
 |
 |
 |
 |
| Characteristics of flow section used in the calculation | |
|---|---|
Example of calculated result
Calculated values
Regarding the roughness coefficient, $n=0.013$ was used for concrete and $n=0.03$ was used for natural river. The calculation was executed under the condition of subcrutucal flow.
 |
| Fig.1 Relationship between the distance and flow section area |
|---|
 |
| Fig.2 Relationship between the distance and water level |
 |
| Fig.3 Relationship between the distance and Froude number |
Comments for calculated values
- Fig.1 is a reference to understand the estimated phenomenon. The flow section areas for specified each elevation are shown in this figure. It can be understood that the smallest flow section area is appeared at the distance of 260m.
- Fig.2 shows the water surface level estimated by the calculation. The anual mean discharge is approximately 60m $^3$ /s, and in the case of discharge of 63m $^3$ /s, the smooth water surface is obtained. In the case of large discharge, discontinuity can be observed near the distance of 260m. In the case of discharge of 1352m $^3$ /s, the water surface elevation cannot be calculated from 230m to 310m.
- Fig.3 shows the Froude number estimated by the calculation. In the case of discharge of 1352m $^3$ /s, Froude number increases steeply at the distance of 310m. This means that the critical depth appeares at the distance of 310m and supercritical flow and hydraulic jump occur between the distance 310m and 230m.
- Fig.4 shows the relationship between the measured data and estimated data by the calculation. Although river cross section model is simplified in this example, the calculation reconstructs measured data approximately.
 |
| Fig.4 Relationship between the measured data and estimated data by the calculation |
|---|
| Measured data | ||||
|---|---|---|---|---|
| Discharge (m3/s) | 21.6 | 65.4 | 139 | Estimated riverbed EL. |
| WL at upstream point (man depth) | EL.47.34 (1.38m) | EL.47.83 (1.74m) | EL.48.42 (2.33m) | EL.46.0 |
| WL at downstream point (mean depth) | EL.47.20 (0.40m) | EL.47.40 (0.60m) | EL.47.90 (1.10m) | EL.46.8 |
Programs
Command for execution
#program   i   Q0     h0     fnameR     >  fnameW
./f90_NUF 10 63.087  0.589 inp_open.txt > outQ0063.txt
./f90_NUF 10 430.92  1.958 inp_open.txt > outQ0430.txt
./f90_NUF 10 1352.01 3.138 inp_open.txt > outQ1352.txt
| i | Integer for specifying the case (10: subcritical flow, 20: supercritical flow) |
| Q0 | Discharge at the starting point of calculation |
| h0 | Water depth at the starting point of calculation |
| fnameR | Input filename |
| fnameW | Output filename |
Program for data input
call getarg(1,dummy1)
call getarg(2,dummy2)
call getarg(3,dummy3)
call getarg(4,fnameR)

read(dummy1,*) icase
read(dummy2,*) Q0
read(dummy3,*) h0

open(11,file=fnameR,status='old')
read(11,*) nd
do i=1,nd
read(11,'()')
read(11,*) k,xx(i),zz(i),nas(i),ninp(i)
do j=1,nas(i)
read(11,*) hh(i,j),area(i,j),wper(i,j),wids(i,j)
end do
end do
close(11)
| nd | Number of the section calculated |
| k | Section No.(arbitrary) |
| xx(i) | Horizontal distance from starting point of calculation |
| zz(i) | Elevation of river bed |
| nas(i) | Number of input for the relationship between depth and section area |
| ninp(i) | Roughness coefficient |
| hh(i,j) | Water depth in the perpendicular direction to the river bed |
| area(i,j) | Section area of flow at the specified water depth |
| wper(i,j) | Wetted perimeter at the specified water depth |
| wids(i,j) | Width of Water surface at the specified water depth |
The sequence of the section shall be from starting point of calculation to end point. In this case, the sequence of section shall be from downstream to upstream because of Subcritical flow.
Items for output
| x1 | Horizontal distance from starting point of calculation |
| Q1 | Discharge |
| a1 | Section area of flow |
| t1 | Width of water surface |
| h1 | Water depth in the perpendicular direction to the river bed |
| z1 | Elevetion of river bed |
| h1+z1 | Elevation of water surface |
| v1 | Mean velocity of flow |
| E1 | Total head of energy (including the dynamic head) |
| Fr | Froude number |
| hc | Critical depth in the perpendicular direction to the river bed |
| it | Count of iteration for convergence |
Programs
| Filename | Description |
|---|---|
| f90_NUF.txt | program for Non Uniform Flow Analysis |
| inp_open.txt | sample of input data |
| outQ0430.txt | sample of output data |
| a_gmt_QH.txt | GMT drawing script |
| a_gmt_XQ.txt | GMT drawing script |