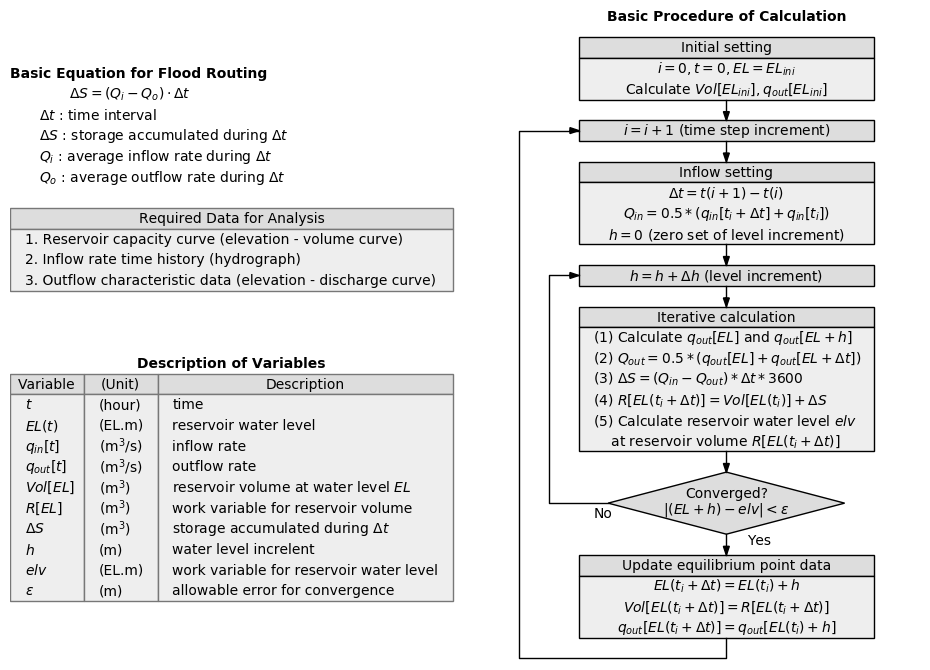
Outline of Flood Routine Analysis
 |
Actual programing
iUD=1        # Assume reservoir water level increase
dh=0.0005    # Water level increment for searching equilibrium point
eps=0.001    # Convergence criteria
itmax=int(1.0/dh)*100
for i in range(0,nd-1):
    dt=ti[i+1]-ti[i]             # Time interval
    Qin=0.5*(q_in[i]+q_in[i+1])  # Average inflow rate during dt
    hh=0.0                       # Zero set of water level increment
    k=0
    j=0
    while 1:
        k=k+1
        j=j+1;
        hh=hh+float(iUD)*dh      # Update waler level increment
        elv=EL;    q1=OFC(elv,elof,qof,no)+outlet
        elv=EL+hh; q2=OFC(elv,elof,qof,no)+outlet
        Qout=0.5*(q1+q2)         # Average outflow rate during dt
        dS=(Qin-Qout)*dt*3600.0  # Storage accumulated during dt
        R=VOL+dS                 # Total reservoir volume
        elv=RET_H(nr,rh,rv,R)    # Reservoir water level at reservoir volume R
        if iUD==1 and j==10:  # 10 times trial assuming reservoir water level increase
            if EL+hh>elv:     # if reservoir water level is less than assumed water level,
                iUD=-1        # assume water level decrease
                hh=0.0
                j=0
        if iUD==-1 and j==10: # 10 times trial assuming reservoir water level decrease
            if EL+hh<elv:     # if reservoir water level is greater than assumed water level,
                iUD=1         # assume water level decrease
                hh=0.0
                j=0
        if np.abs(EL+hh-elv)<eps: break  # Judgement of convergence
        if itmax<k: break
    VOL=R    # Cumulative volume
    EL=EL+hh # Elevation
    q_out=q2 # Outflow
    print(i+1,iUD,ti[i+1],EL,EL-elv,VOL,q_in[i+1],q_out,file=fout)
    pEL[i]=EL
    pQo[i]=q_out
    sys.stdout.write('\r%d / %d' % (i+1,nd-1))
    sys.stdout.flush()
Programs and Script
| Program name | Description |
|---|---|
| py_eng_floodrT.py | Program for flood routine analysis |
| py_eng_fig_floodrT.py | Drawing program of the result |
| py_fig_inp.py | Drawing program of input data |
| py_hv.py | Program for making reservoir capacity (H-V) curve by cubit spline interpolation |
| py_hydro.py | Program for making inflow time history data (hydrograph) by lenear interpolation |
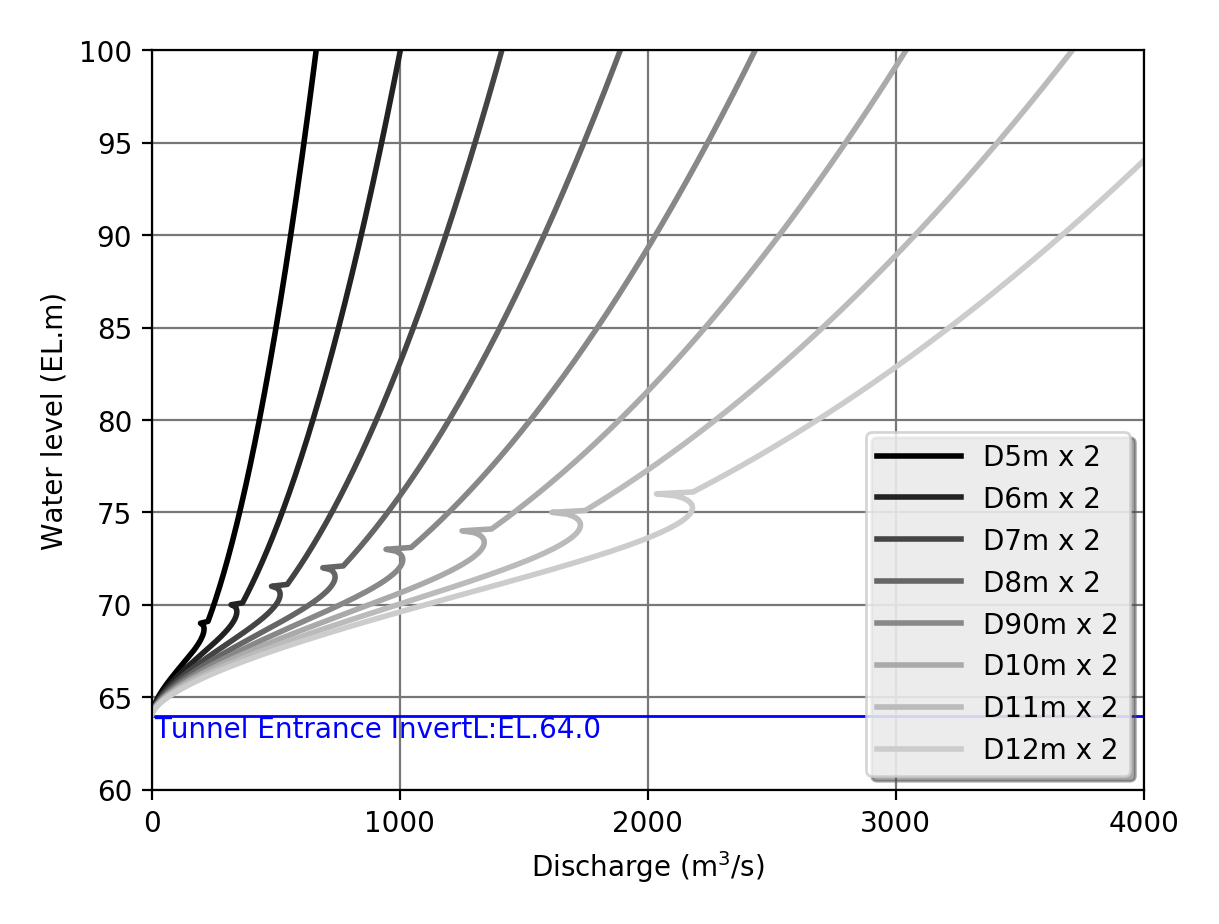
| py_TNHQ.py | Program for making outflow characteristic data (elevation-discharge curve) of tunnel |
| py_table.py | Program for summary table of the results |
| hv0.txt | Basic reservoir capacity data |
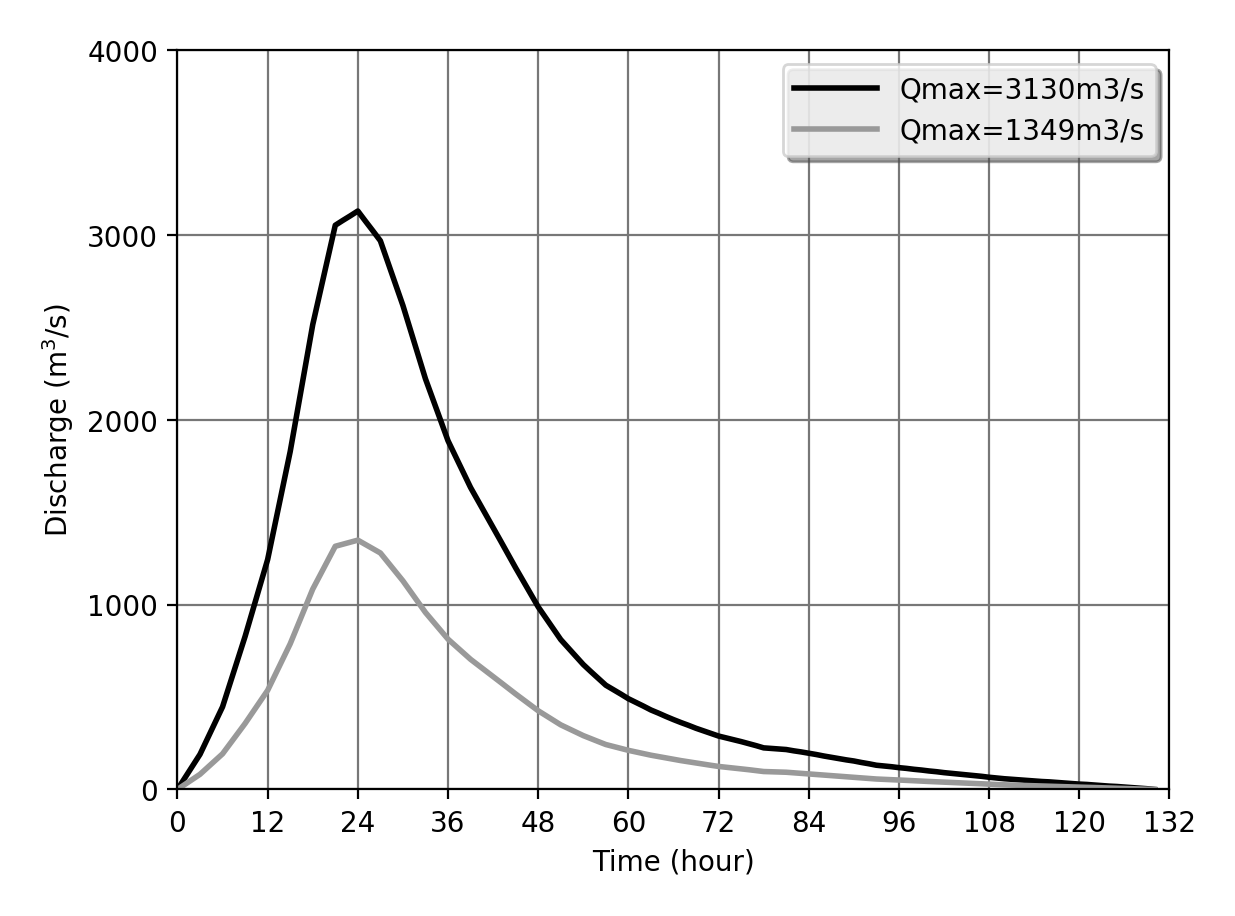
| hydro0.txt | Basic inflow time history data (hydrograph) |
| a_py.txt | Shell script for execution of all steps automatically |
Usage of programs
# Make inflow time history data (hydrograph)
python py_hydro.py  Qmax  dt  >  fnameW.txt
| Qmax | : maximum discharge |
| dt | : time increment |
| fnameW.txt | : output of this program (inflow time history) |
# Make outflow characteristics data
python py_TNHQ.py  D  dh  frameW.txt
| D | : tunnel internal diameter |
| dh | : elevation interval for calculation of outlow characteristics |
| fnameW.txt | : output of this program (outflow characteristics of two tunnels) |
# Flood routine analysis
python py_eng_floodrT.py  fnameR1.txt  fnameR2.txt  fnameR3.txt  fnameW.txt
| fnameR1.txt | : reservoir capacity curve data |
| fnameR2.txt | : inflow time history data |
| fnameR3.txt | : outflow characteristics data |
| fnameW.txt | : output of this program |
# Draw the graph from calculation result
python py_eng_fig_floodrT.py  fnameR.txt  fnameF.png
| fnameR.txt | : input file (output file of 'py_eng_floodrT.py') |
| fnameF.png | : output image file |
Related program
| Program name | Description |
|---|---|
| py_fig_tunnel.py | Drawing program of basic tunnel shape |
| py_fig_flowchart.py | Drawing program of flowchart for flood routine analysis |
| py_fig_table.py | Drawing program of table |
# Draw the basic tunnel shape
python py_fig_tunnel.py
convert -trim fig_tunnel.png -bordercolor 'white' -border 10x10 fig_tunnel.png
# Draw the flowchart for flood routine analysis
python py_fig_flowchart.py  flag
convert -trim fig_flowchart.png -bordercolor 'white' -border 20x20 fig_flowchart.png
# flag=0: without axes and grid
# flag=1: with axes and grid
# Draw the table for explanation of symbles in flowchart
python py_fig_table.py  flag
convert -trim fig_table.png -bordercolor 'white' -border 5x5 fig_table.png
# flag=0: without axes and grid
# flag=1: with axes and grid
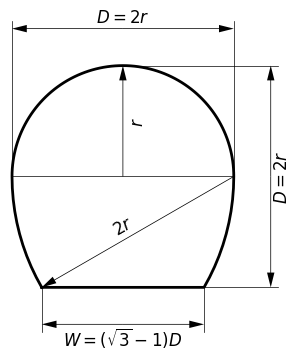
Information of Diversion Tunnels
Basic data of structures
|
|
| Items | Inside | Outside |
|---|---|---|
| Length | L=400m | L=450m |
| Invert level of entrance | EL.64.0m | EL.64.0m |
| Invert level of exit | EL.62.5m | EL.62.5m |
| Gradient | I=0.00375 | I=0.00333 |
| Curve-1 | Bending radius: $\rho$=230m Bending angle: $\theta$=39.5 deg. | Bending radius: $\rho$=260m Bending angle: $\theta$=39.5 deg. |
| Curve-2 | Bending radius: $\rho$=200m Bending angle: $\theta$=48.2 deg. | Bending radius: $\rho$=230m Bending angle: $\theta$=48.2 deg. |
Calculation formula of mean velocity of free flow tunnel
\begin{equation} v=\cfrac{1}{n}\cdot R^{2/3}\cdot I^{1/2} \end{equation}where, $v$ is mean velocity of free flow tunnel, $n$ is Manning's roughness coefficient ($n=0.015$), $R$ is hydraulic radius.
Calculation formula of mean velocity of pressure tunnel
\begin{equation} v=\sqrt{\cfrac{2 g \Delta H}{f_e+f_o+f_{b1}+f_{b2}+f\cdot L/R}} \end{equation}where, $v$ is mean velocity of pressured tunnel, $\Delta H$ is difference of water level between tunnel entrance and tunnel exit.
| Items | Head loss coefficient |
|---|---|
| Entrance head loss | $f_e$=0.25 |
| Exit head loss | $f_o$=1.0 |
| Bending head loss | $f_b=[0.131+0.1632\cdot(D / \rho)]\cdot\sqrt{\theta / 90}$
$D$: Tunnel diameter (m) $\rho$: Bending radius (m) $\theta$: Bending angle (degree) |
| Friction head loss | $f=\cfrac{2 g n^2}{R^{1/3}} \qquad (n=0.015)$
$R$: hydraulic radius |
To make outflow characteristic data for analysis, summation of the discharges at the same elevation for each tunnel.
Input data for flood routing
|
 |
||||||||||||||||||||||||||
| Basic Reservoir capacity data (10m level interval) | Reservoir capacity curve by cubic spline interpolation with 1m level interval | ||||||||||||||||||||||||||
|---|---|---|---|---|---|---|---|---|---|---|---|---|---|---|---|---|---|---|---|---|---|---|---|---|---|---|---|
 |
 |
||||||||||||||||||||||||||
| Inflow time history (hydrograph) with 1 hour time interval | Outflow characteristics for two diversion tunnels with 0.1m level interval |
Calculation results
| Item | Value |
|---|---|
| Elevation interval for searching equilibrium point | 0.5mm |
| Condition for convergence of water level | 1.0mm |
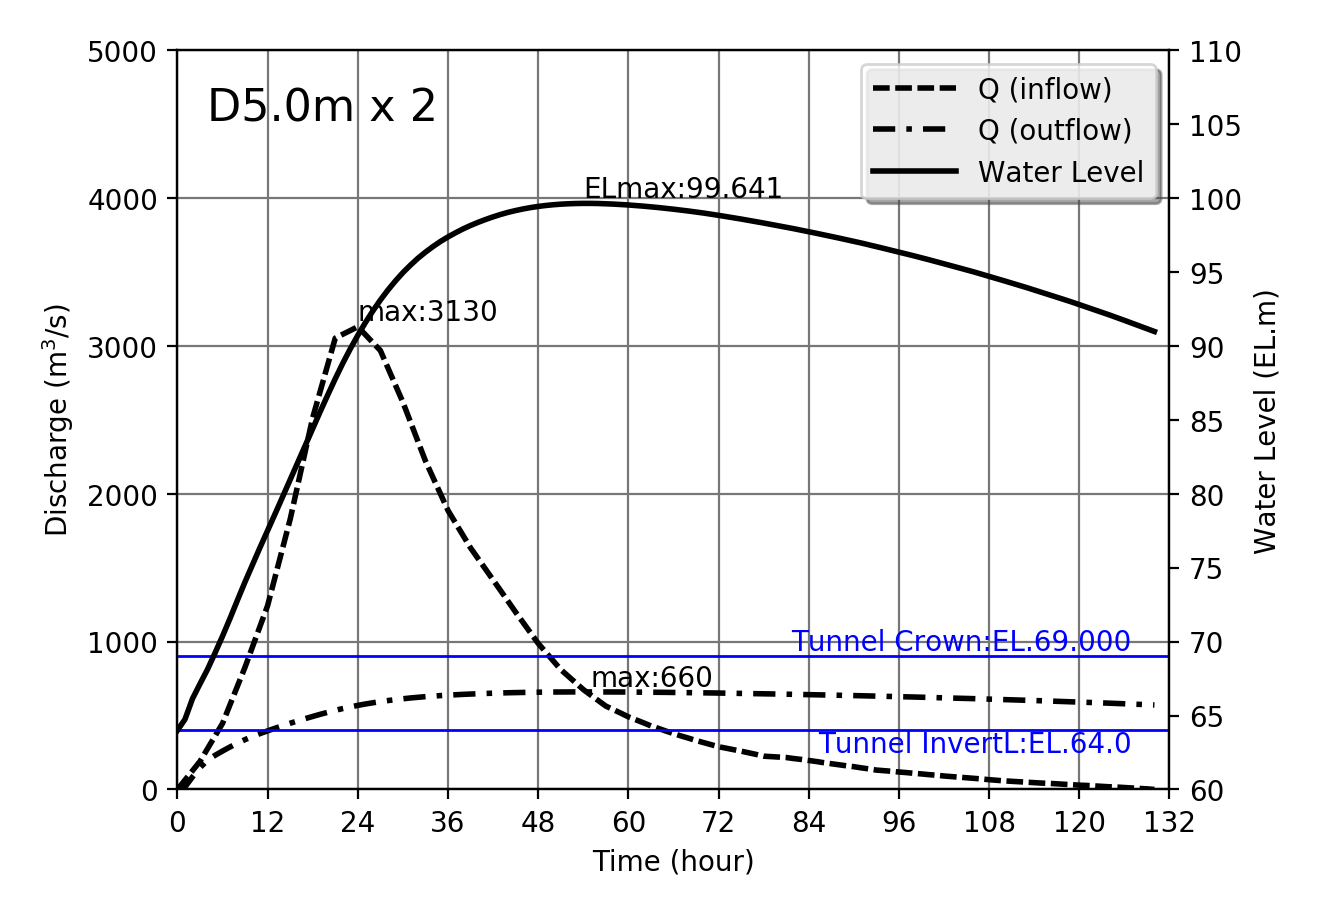
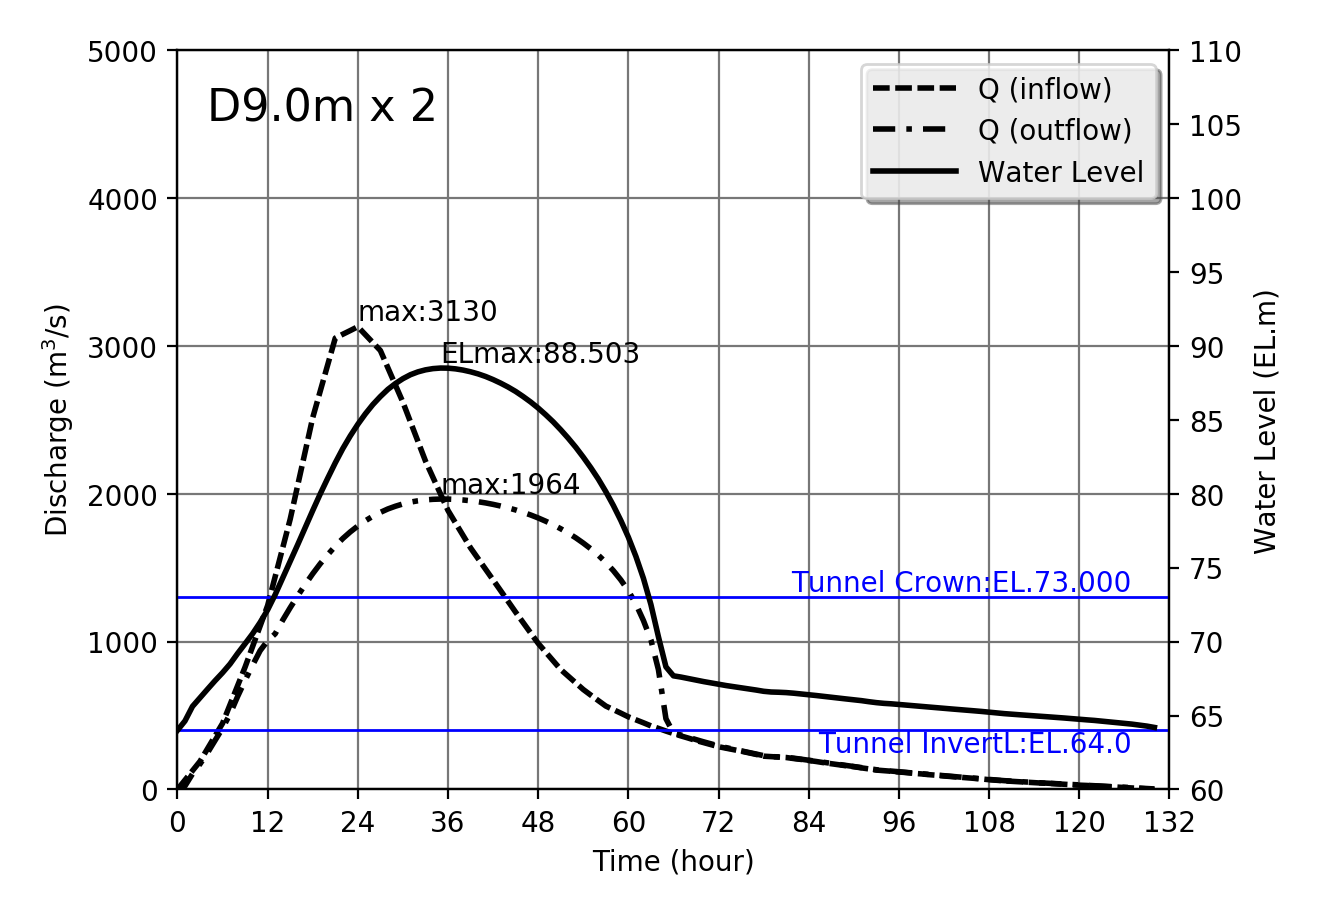
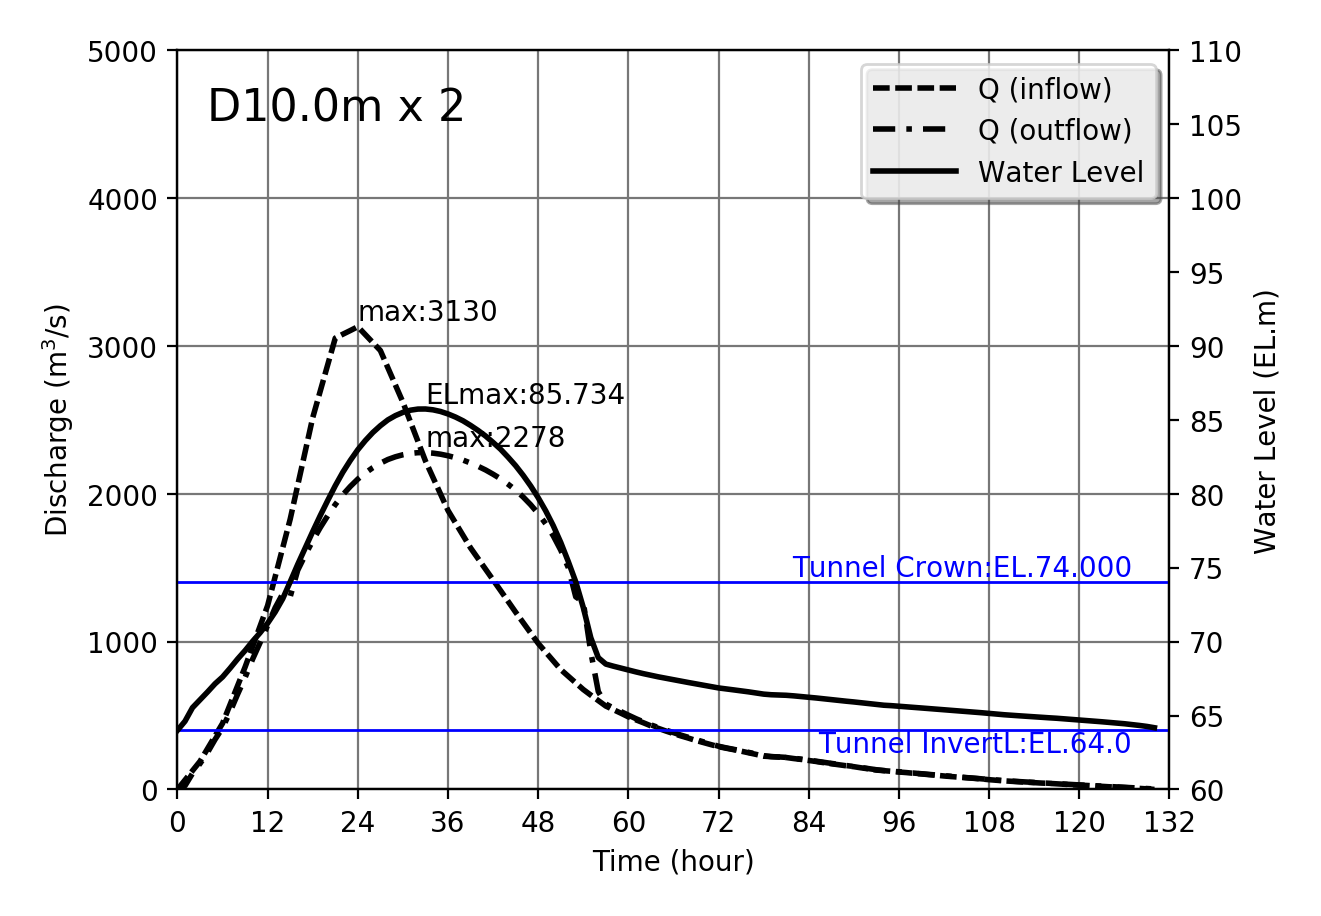
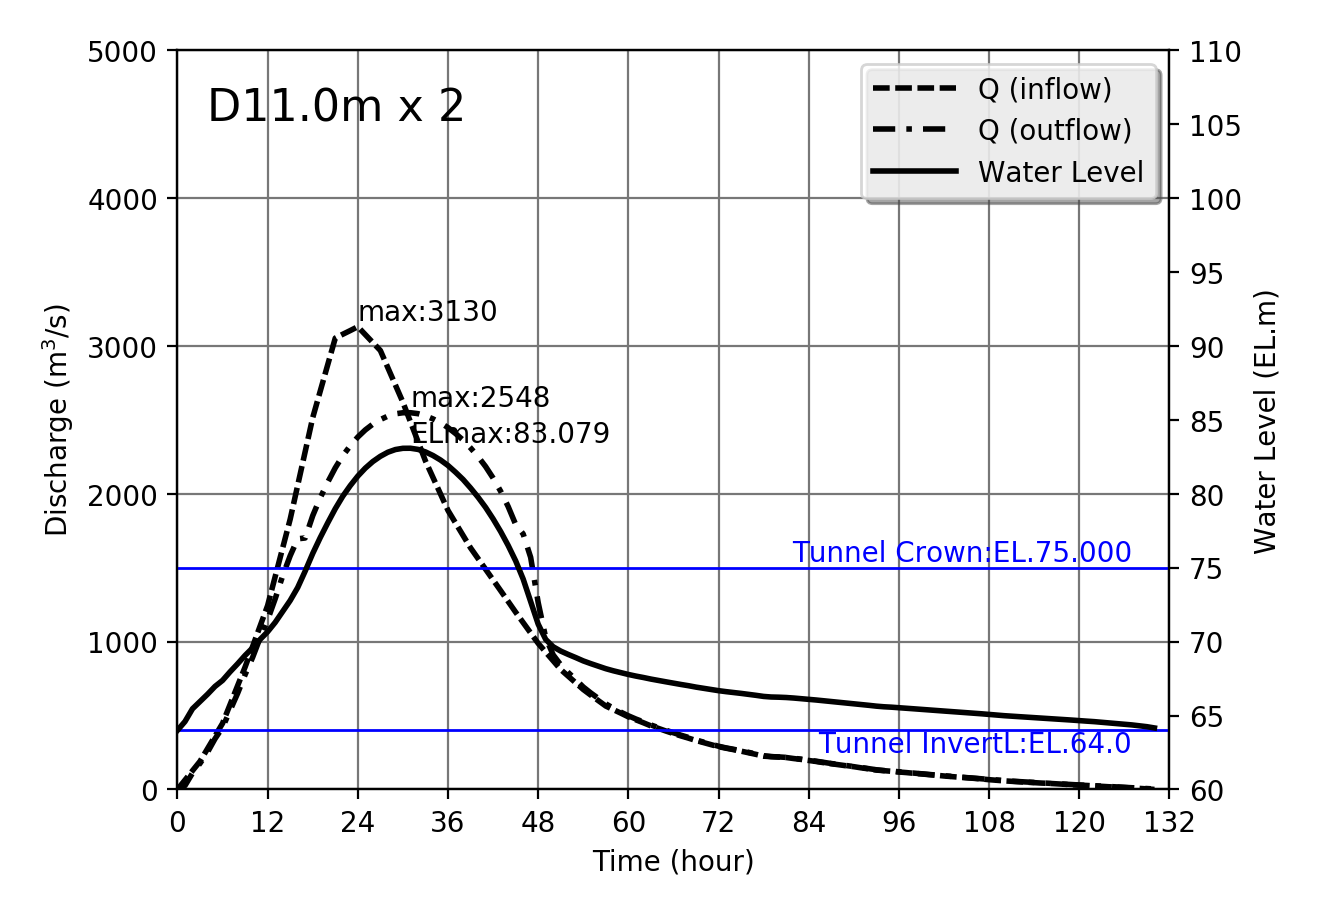
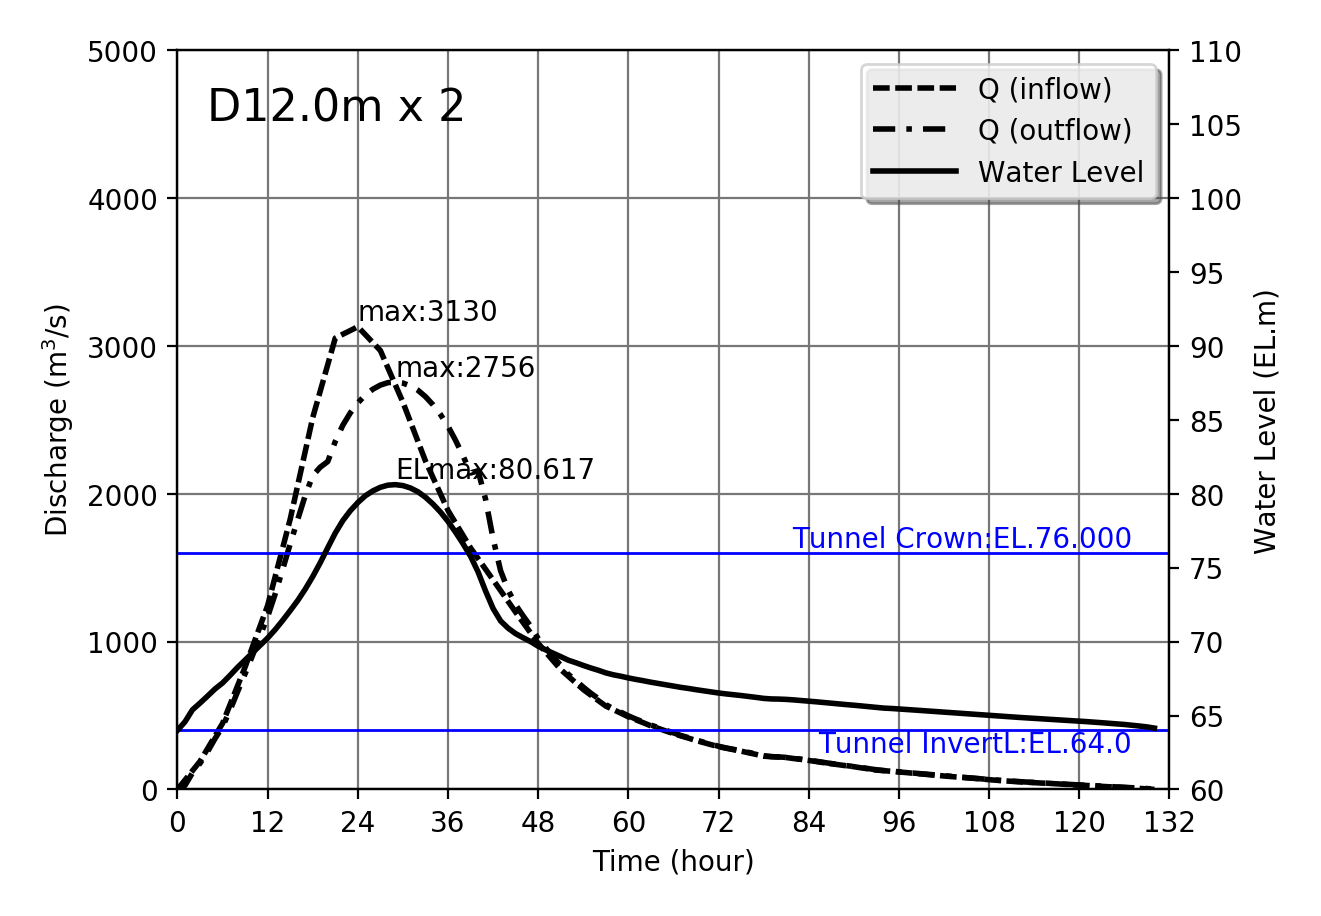
Design flood Qmax=3130m$^3$/s
| Qin[max] (m3/s) | Diversion Tunnel | EL[max] (m) | Qout[max] (m3/s) | Flow area (m2) | Mean velocity (m/s) |
|---|---|---|---|---|---|
| 3130 | D5.0m x 2 | 99.641 | 660 | 42.405 | 15.561 |
| 3130 | D6.0m x 2 | 97.062 | 959 | 61.084 | 15.699 |
| 3130 | D7.0m x 2 | 94.262 | 1287 | 83.161 | 15.479 |
| 3130 | D8.0m x 2 | 91.364 | 1628 | 108.636 | 14.984 |
| 3130 | D9.0m x 2 | 88.503 | 1964 | 137.508 | 14.284 |
| 3130 | D10.0m x 2 | 85.734 | 2278 | 169.777 | 13.419 |
| 3130 | D11.0m x 2 | 83.079 | 2548 | 205.444 | 12.403 |
| 3130 | D12.0m x 2 | 80.617 | 2756 | 244.508 | 11.270 |
 |
 |
 |
 |
 |
 |
 |
 |
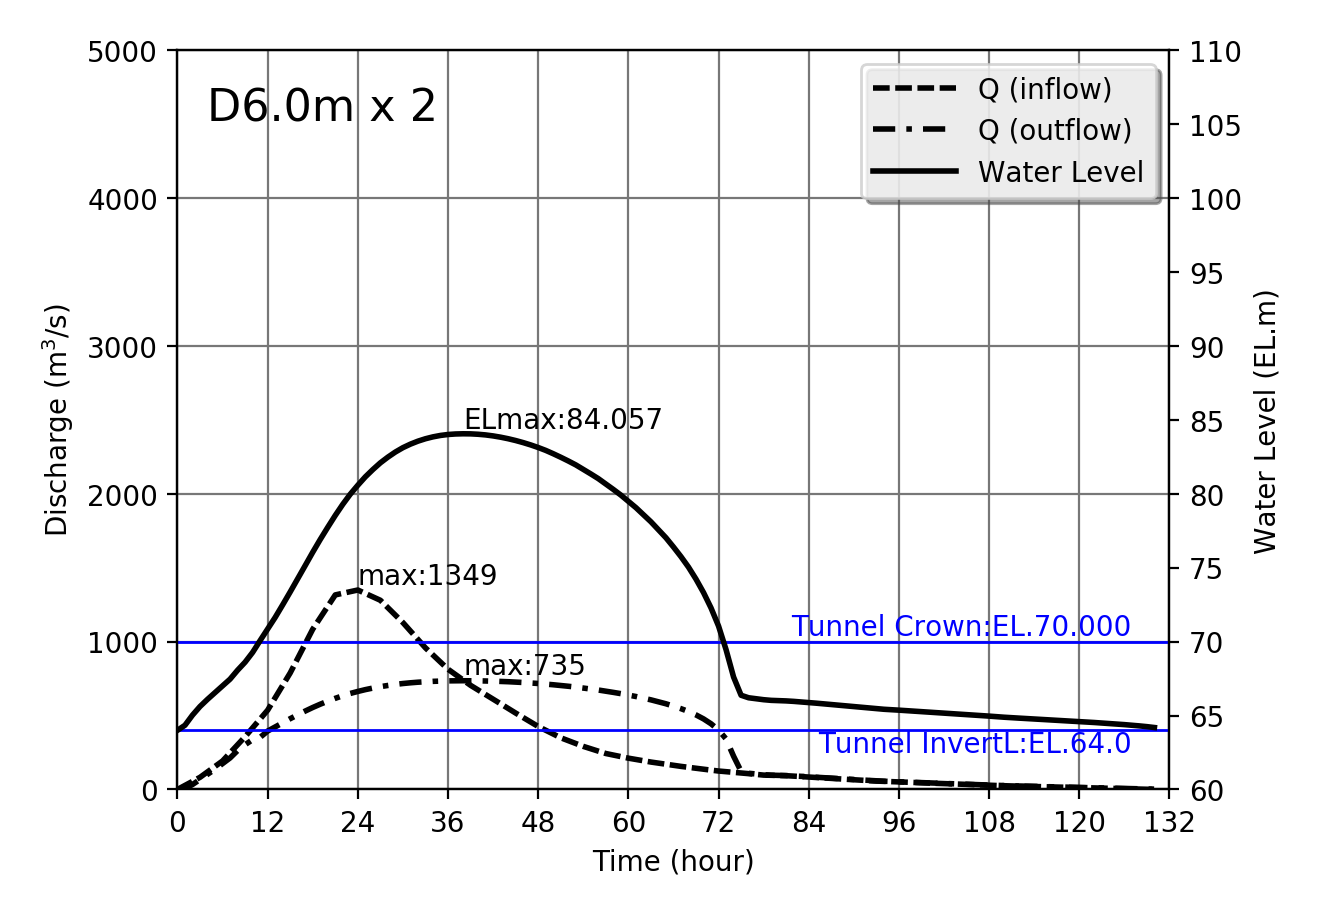
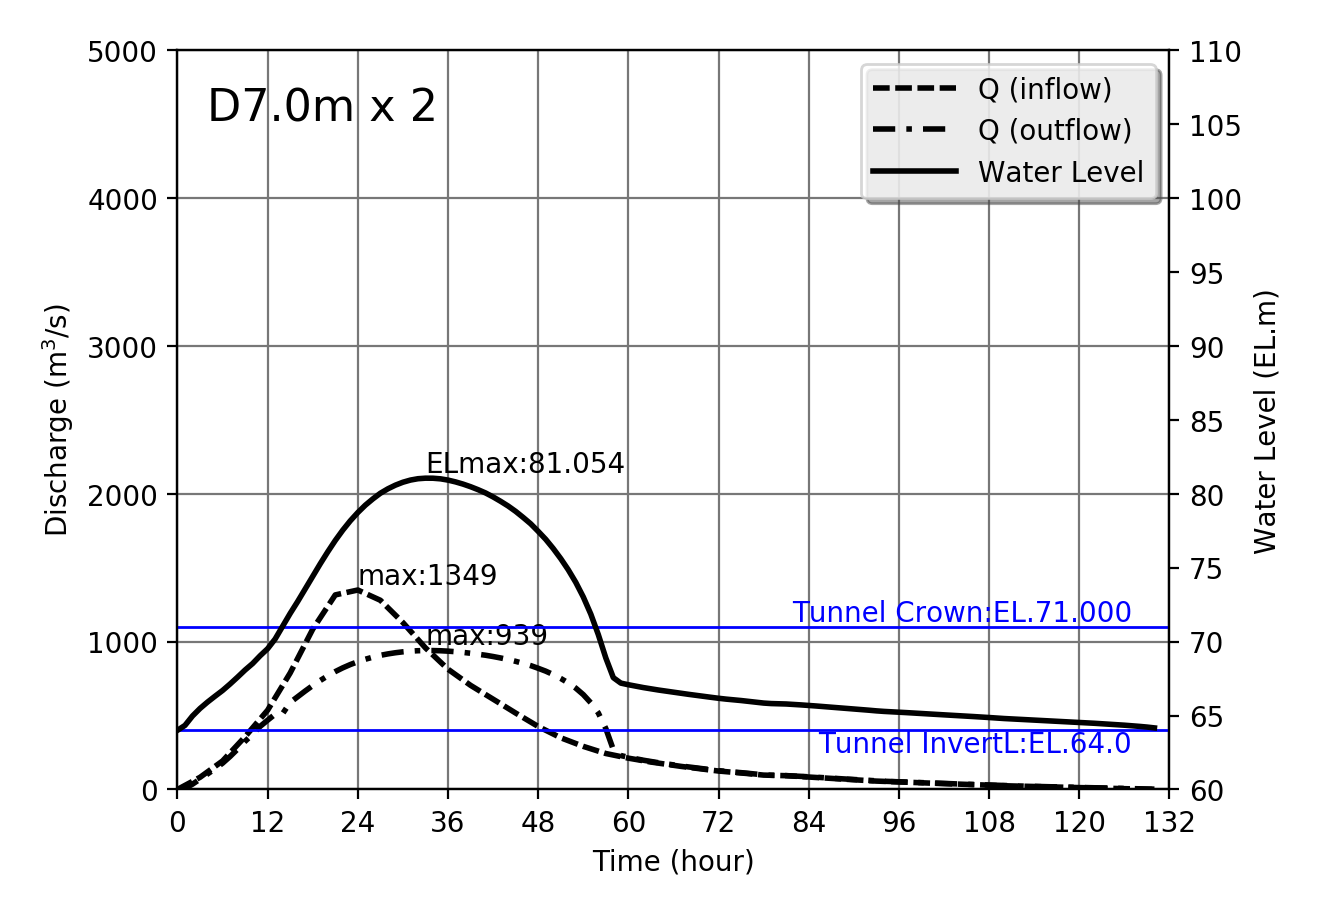
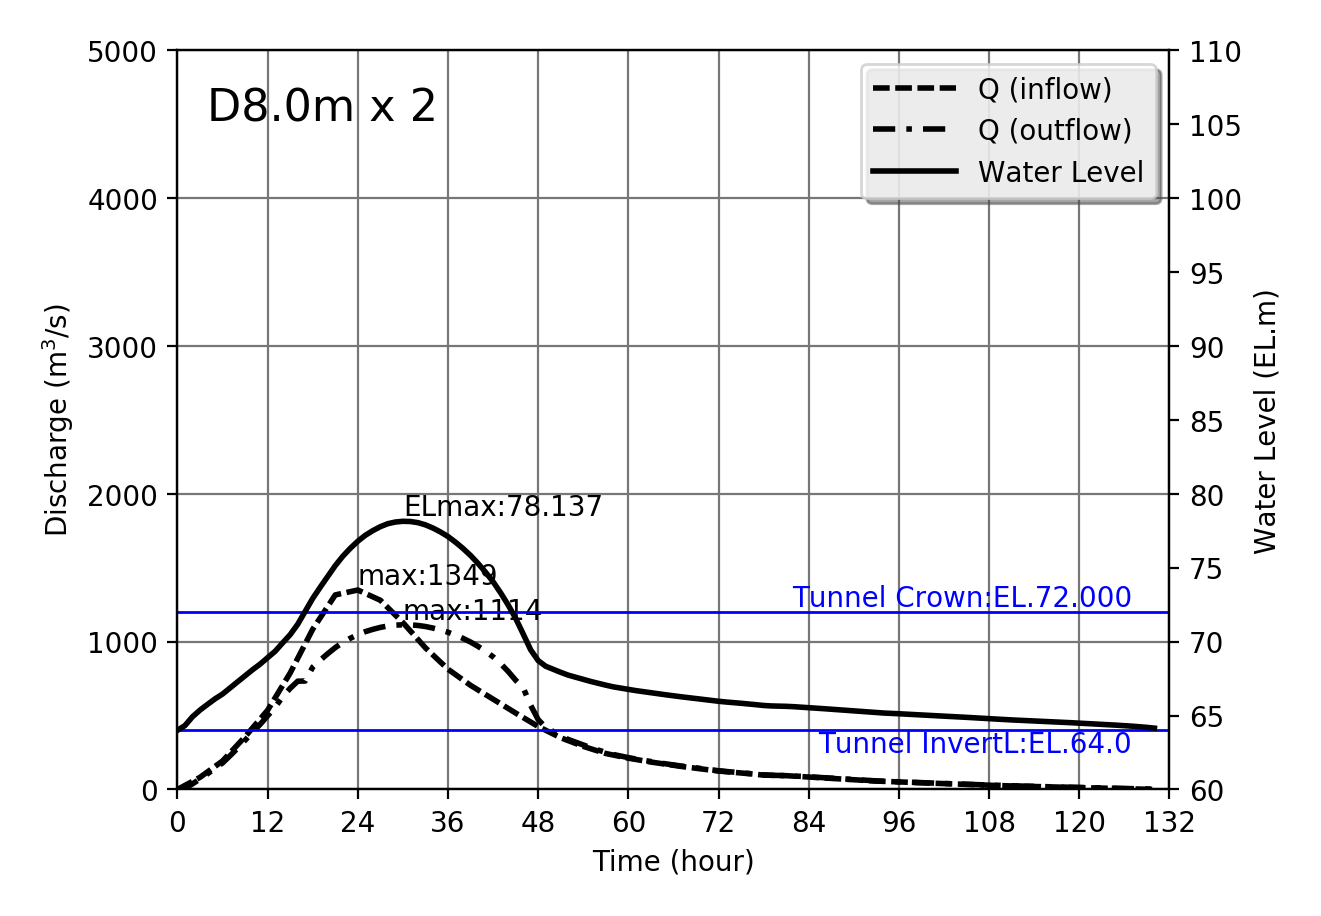
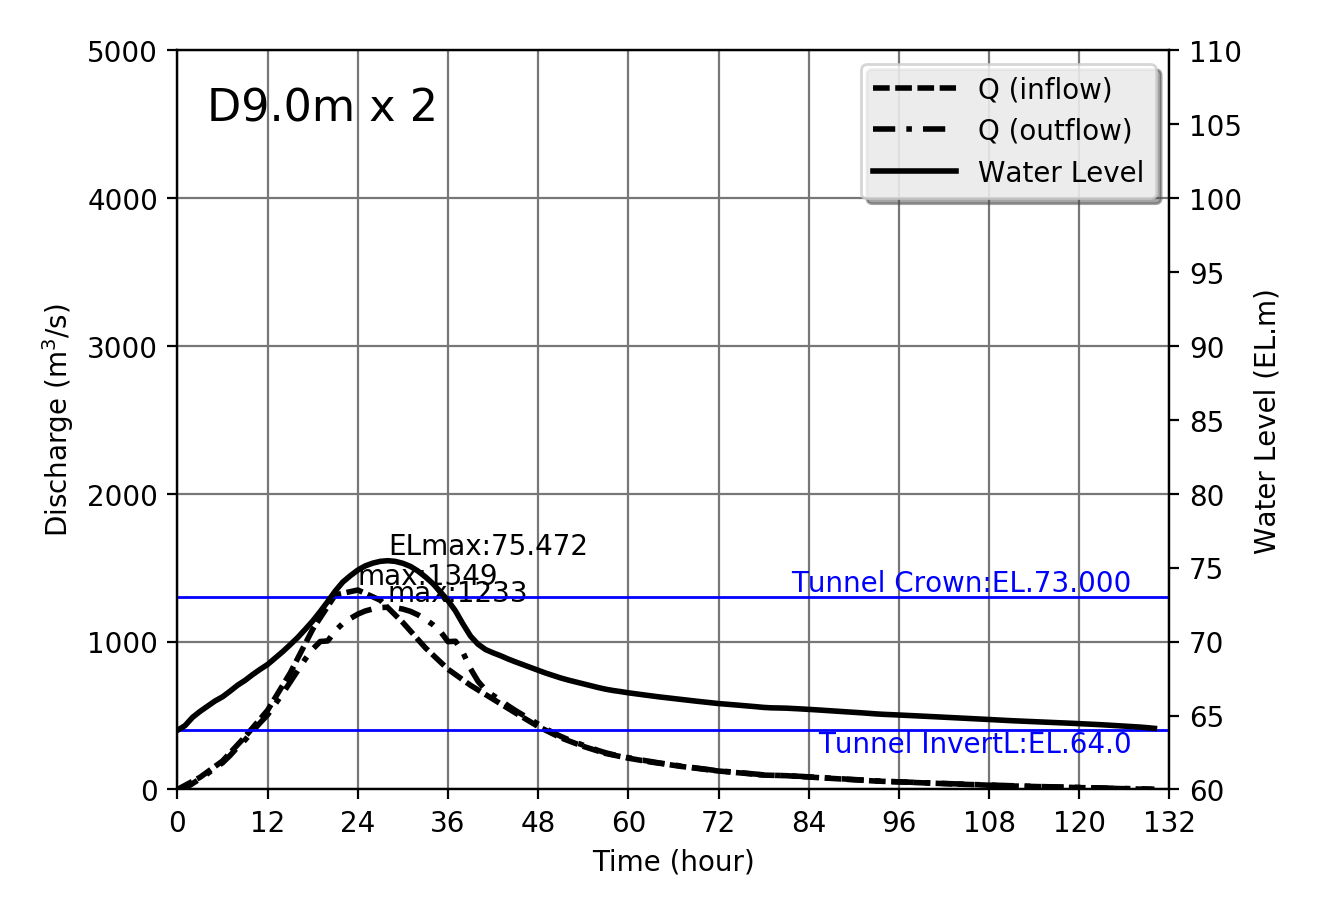
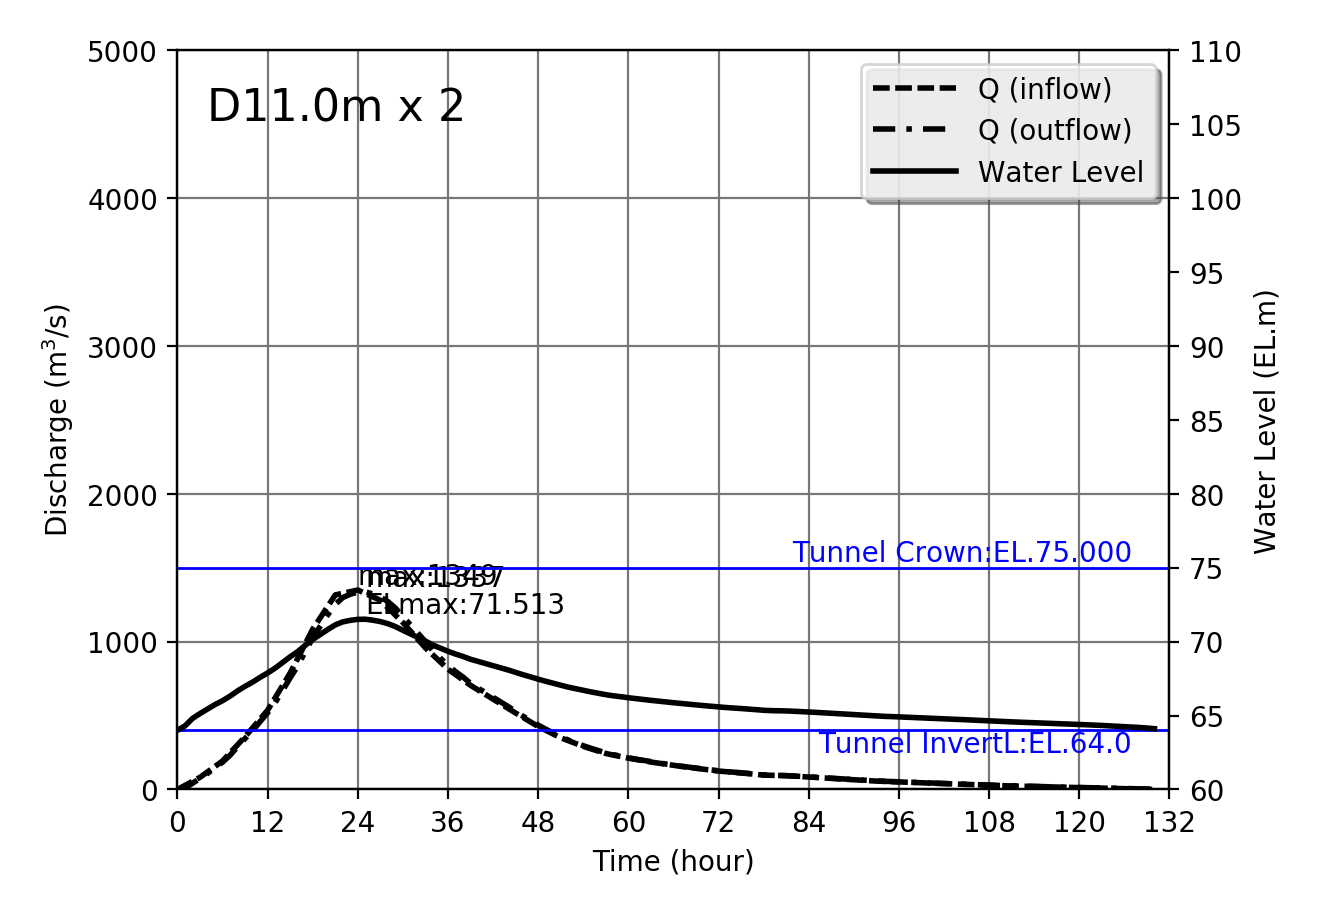
Design flood Qmax=1349m$^3$/s
| Qin[max] (m3/s) | Diversion Tunnel | EL[max] (m) | Qout[max] (m3/s) | Flow area (m2) | Mean velocity (m/s) |
|---|---|---|---|---|---|
| 1349 | D5.0m x 2 | 87.073 | 527 | 42.405 | 12.421 |
| 1349 | D6.0m x 2 | 84.057 | 735 | 61.084 | 12.038 |
| 1349 | D7.0m x 2 | 81.054 | 939 | 83.161 | 11.297 |
| 1349 | D8.0m x 2 | 78.137 | 1114 | 108.636 | 10.251 |
| 1349 | D9.0m x 2 | 75.472 | 1233 | 137.508 | 8.966 |
| 1349 | D10.0m x 2 | 72.733 | 1311 | 158.293 | 8.282 |
| 1349 | D11.0m x 2 | 71.513 | 1337 | 153.772 | 8.692 |
| 1349 | D12.0m x 2 | 70.884 | 1342 | 152.640 | 8.791 |
 |
 |
 |
 |
 |
 |
 |
 |